
Sensing the City: Decoding Urban Behavior via Geo-tagged Micro-blogs
Discovery of user behavior paerns from geo-tagged micro-blogs
The paper introduces a framework for the "Discovery of User Behavior Patterns from Geo-tagged Micro-blogs," specifically leveraging Twitter data to analyze human mobility. It utilizes a quad-tree based adaptive space partitioning method for data gathering and applies K-means clustering alongside "Aggregation" and "Dispersion" models to identify regional social characteristics and significant urban events.
TL;DR
At the dawn of the mobile social media era, this research pioneered a way to treat millions of Twitter users as a distributed network of "human sensors." By applying a quad-tree based gathering framework and spatial clustering, the authors can distinguish between a business district, a transportation hub, and a tourist trap simply by observing "Aggregation" and "Dispersion" patterns of tweets.
The Evolution of Geographic Social Media
Before 2010, understanding how a city "breathes"—where people congregate, when they commute, and where they travel for leisure—required expensive census data or limited GPS tracking studies. The explosion of micro-blogging (Twitter) changed the game. However, the technical challenge was significant: how do you systematically collect data from a massive geographic area (like the whole of Japan) when API limits restrict you to small circular windows?
Methodology: The Quad-tree and Movement Models
1. Adaptive Data Gathering
To bypass the limitations of the Twitter API, the authors didn't use a uniform grid. Instead, they employed Adaptive Space Partitioning using a Quad-tree.
- The Logic: If a region has too many tweets (exceeding API limits), the system splits that rectangle into four smaller ones.
- The Result: High-density areas like Tokyo get high-resolution monitoring "radar," while rural areas are covered by larger, broader nodes.
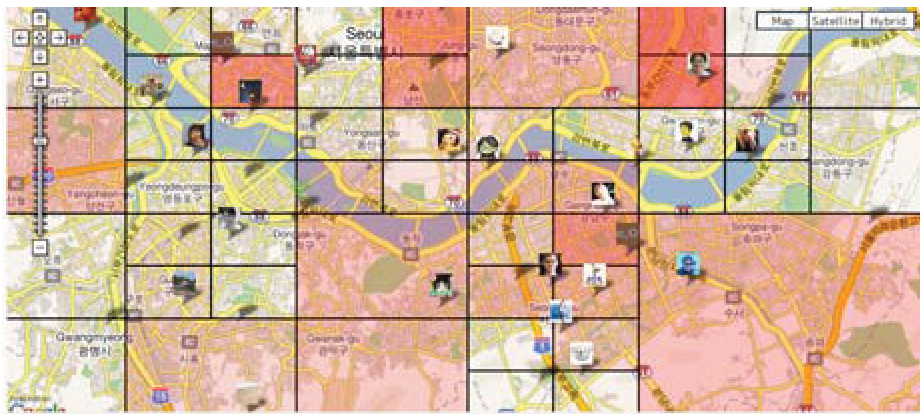 Figure: The Quad-tree density map over the Tokyo area.
2. Aggregation & Dispersion Models
Once the tweets are clustered using K-means, the research moves beyond "where people are" to "how they move."
- Aggregation: Measures the ratio of new users entering a cluster at time . High aggregation in the morning suggests a workplace or school.
- Dispersion: Measures the ratio of users leaving a cluster. High dispersion in the evening usually indicates a commercial or transit area.
Experimental Insights: Tokyo’s Digital Footprint
The researchers analyzed three distinct clusters in Tokyo to validate their models:
- Cluster A (Tokyo Station): Showed high levels of both aggregation and dispersion throughout the day, characteristic of a major transportation hub.
- Cluster B (Shinagawa): A business district where aggregation peaked in the morning as office workers arrived, with minimal dispersion until later in the day.
- Cluster C (Odaiba): A tourist spot. The model found 0.0% dispersion in the morning (everyone was arriving to stay) and a massive spike in dispersion in the evening.
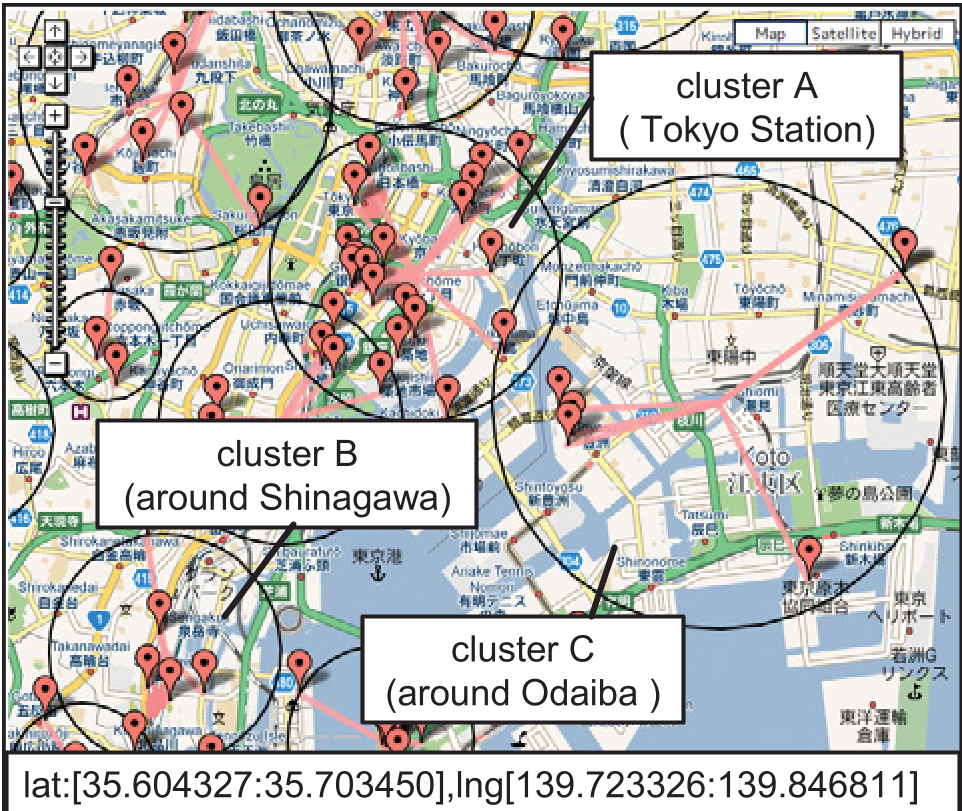 Figure: K-means clusters visualized around Tokyo Station.
Measuring "Activity"
The authors also introduced an Activity Score, which normalizes the total distance moved by users within a cluster against the cluster's radius and the number of users. During the "Bon" festival in Japan, they observed high activity scores in Tokyo. This wasn't just local commuting; it represented the "U-turn" phenomenon where urban residents travel long distances back to their hometowns.
Critical Insight & Future Outlook
While this 2010 work laid the groundwork, it highlights an early version of Crowd Mining. The authors accurately predicted that micro-blogs would become the primary source for identifying "unusual social phenomena" (like the Mumbai terror attacks or the Iranian protests).
The main limitation of this early approach was its reliance purely on coordinates () rather than the content () of the tweets. Modern pipelines now integrate NLP (Natural Language Processing) to determine not just that someone is moving, but why they are moving (e.g., "stuck in traffic" vs "arrived at the festival").
Conclusion
This paper serves as a foundational text for Urban Computing. It proves that social media is more than just "online chatter"—it is a real-time, geographic reflex of the physical world. By quantifying the ebb and flow of a city through the lens of a quad-tree, we can build smarter, more responsive urban environments.