
Uncovering the "Why" Behind the "Who": How Dominant Attributes Shape Our Online Social Circles
Uncovering the effect of dominant attributes on community topology: A case of facebook networks
The paper introduces a quantitative framework to identify "dominant attributes" that drive community formation in social networks using a Game-Theoretic Clustering approach. By analyzing Facebook datasets from 100 U.S. universities, it establishes a correlation between specific node attributes (like graduation year and academic major) and resulting community topologies such as size and density.
TL;DR
Why do we form specific groups on social media? This paper moves beyond just finding communities to explaining them. By introducing the Dominance Ratio, researchers identified that in university settings, your graduating class year and major are the primary "dominant attributes" that predict the density and size of your Facebook communities, outperforming factors like dormitory location.
Problem & Motivation: The Gap Between Structure and Logic
In network science, we are great at detecting clusters (communities) where nodes are more densely connected to each other than to the rest of the world. However, most algorithms treat nodes as mere biological or digital points. In reality, nodes have attributes—gender, age, occupation, or interests.
Existing research often looks at "global" dominance—asking which attribute defines the whole network's structure. But this paper argues that dominance is local. A specific major might dominate one community but be irrelevant in another. The challenge is quantifying this "dominance" to understand the transition from offline characteristics to online social consequences.
Methodology: Gaming the System and Quantifying Dominance
The authors utilize two sophisticated tools to solve this:
1. Game-Theoretic Clustering
Unlike traditional algorithms that force a person into one group, this method treats each node as a "player" seeking to maximize rewards by joining clusters where their neighbors are present. This naturally allows for overlapping communities, reflecting the real world where you belong to a family group, a work group, and a hobby group simultaneously.
2. The Dominance Ratio ()
To determine if an attribute is truly "dominant," the researchers formulated: Where is the percentage of an attribute in a community and is the percentage in the whole population. If the ratio is , that attribute is over-represented, suggesting it is a driving force for that specific group.
 Fig 1: Identifying dominant attributes in (a) global community structure vs (b) local specific communities.
Experiments: Facebook at 100 Universities
The researchers tested this on a 2005 snapshot of Facebook data from 100 U.S. colleges. They focused on three primary attributes: Class Year, Major, and Dorm.
Key Findings:
- The "Freshman" Effect: People in the Class of 2010 (likely freshmen at the time of data) formed significantly smaller and denser groups than older students.
- Major vs. Dorm: Studying the same major was a much stronger predictor of forming a dense community than living in the same dormitory. Academic similarities create stronger social "glue" than mere geographical proximity.
- Overlapping vs. Non-Overlapping: The results were much more pronounced when using overlapping community detection. When groups were forced to be non-overlapping, the signals from attributes like "Major" became significantly weaker.
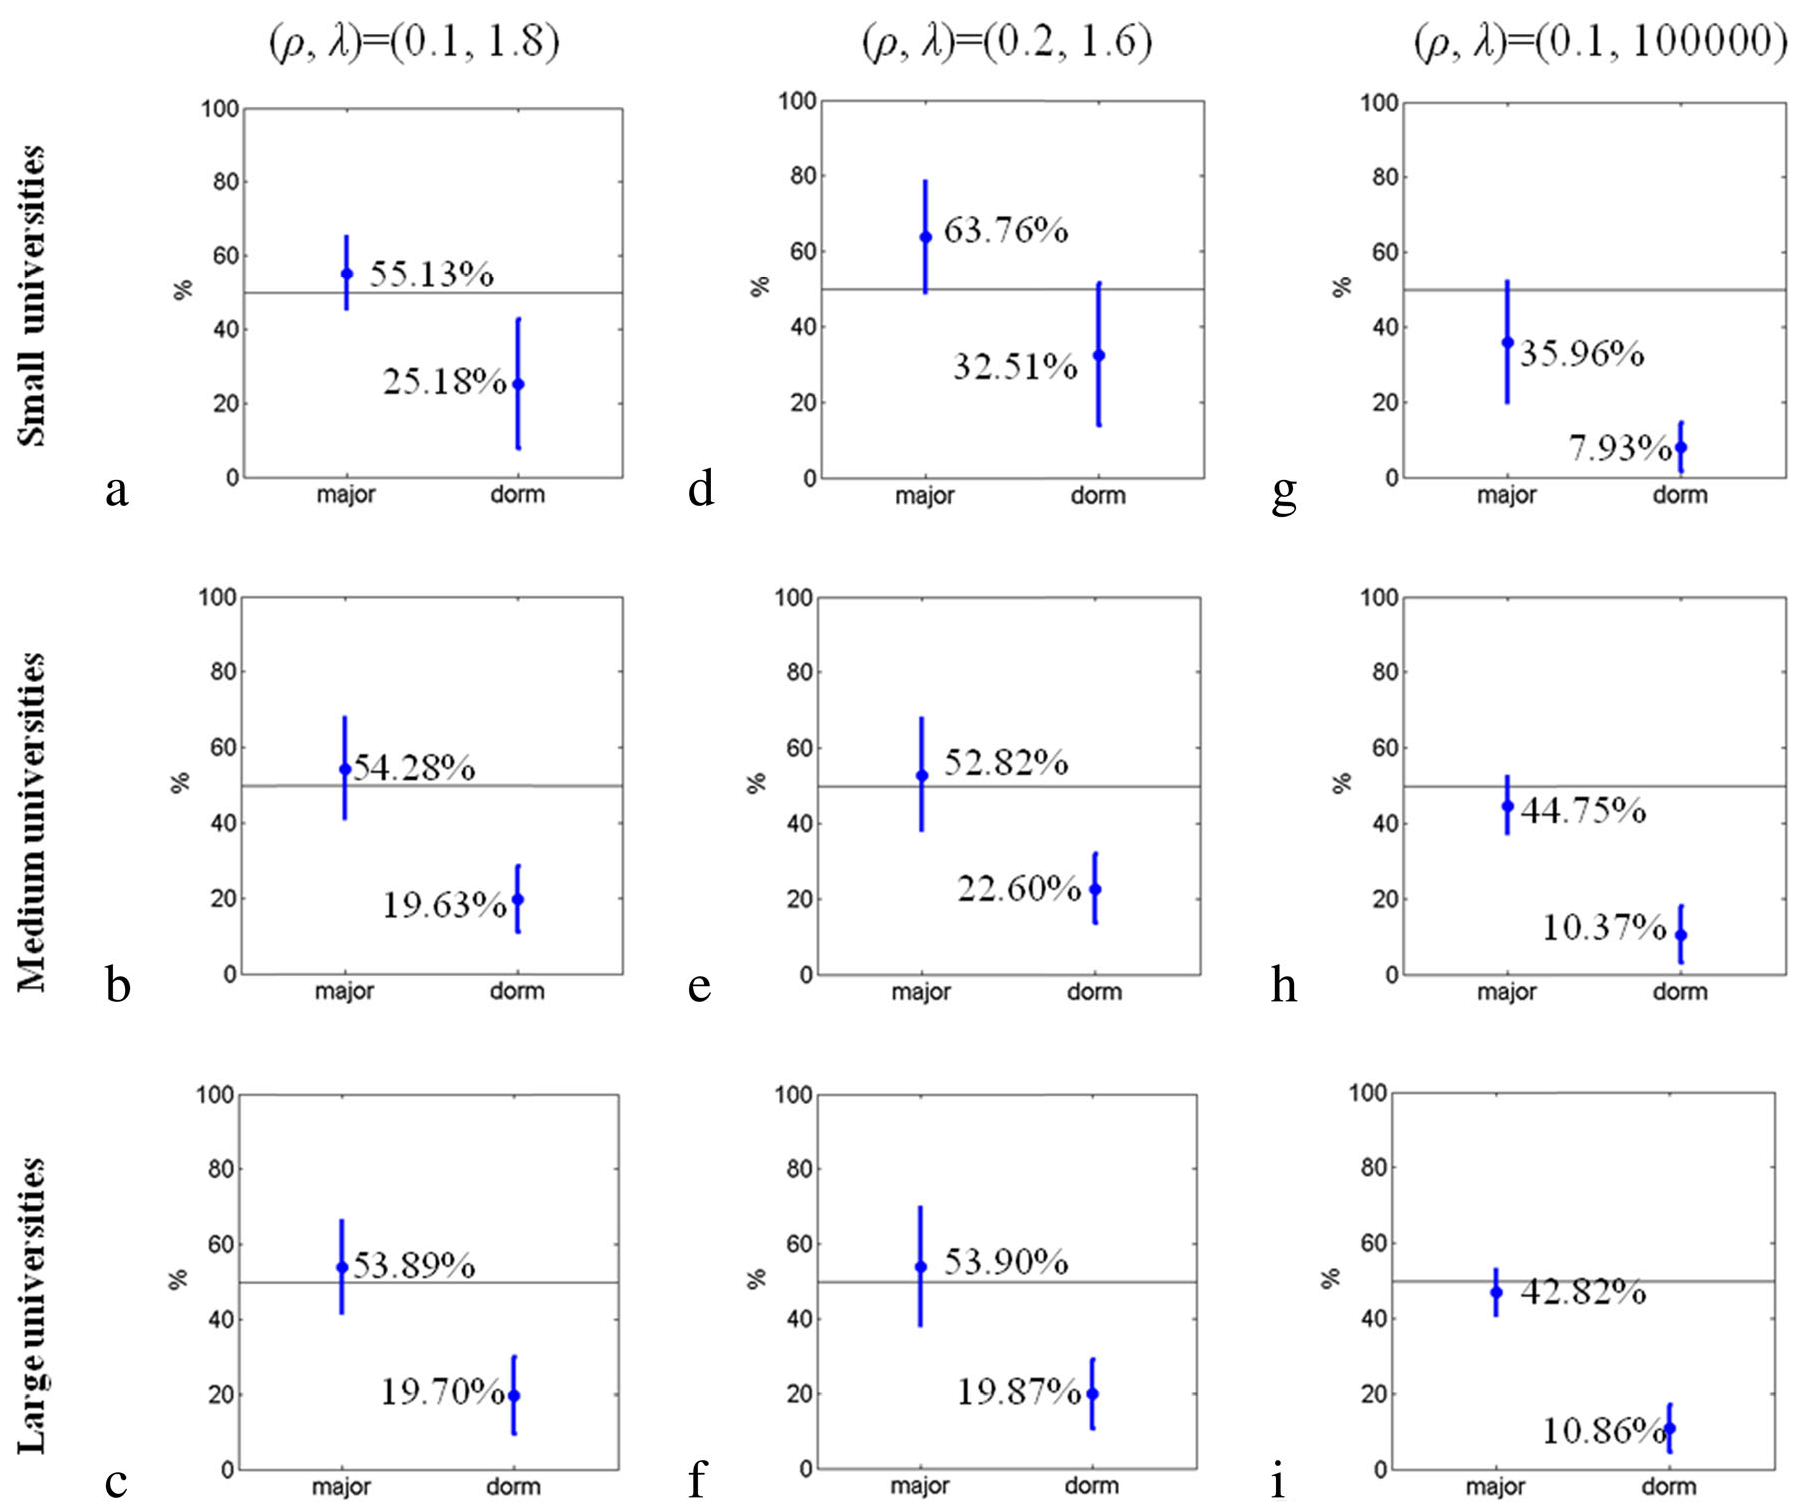 Fig 2: Percentage of majors/dorms showing strong negative correlation with community size across different universities.
Critical Insight & Conclusion
The core takeaway is that offline lives infer online consequences. Social network topology isn't random; it's a reflection of specific demographic drivers.
Why this matters for the industry:
For e-marketing, these findings suggest that you don't actually need to map the entire "graph" of a social network (which is often private). By knowing the dominant attributes (like graduation year or major), you can predict which groups will be small, dense, and "viral," allowing for hyper-targeted campaigns based on simple demographic data.
Limitations: The study uses data from 2005. The "Facebook of today" is vastly different from the collegiate directory it once was. Future research should apply this dominance ratio to modern multi-modal networks where attributes are dynamic (e.g., evolving interests rather than fixed grad years).