
DST: Quantifying Real-World Bonds Through the Lens of Soft Sensory Data
DST: days spent together using soft sensory information on OSNs—a case study on Facebook
The paper introduces DST (Days Spent Together), an algorithm that leverages "soft sensory" data—social media photos, geo-tags, and metadata—to estimate the physical face-to-face (F2F) time shared by users. By learning from popular tour package durations and individual geographical profiles, it transforms sparse digital check-ins into continuous duration estimates.
TL;DR
How much time do you actually spend with your friends? While Facebook knows who you tag, it rarely knows how long you stayed together. This paper introduces the DST (Days Spent Together) algorithm, which uses "soft sensory" information (photo metadata and geo-tags) combined with travel industry logic to estimate the duration of face-to-face interactions. It successfully bridges the gap between digital "check-ins" and real-world presence with up to 84% accuracy for travel events.
Context: OSNs as a Global Sensor Network
Current research in social computing often struggles with a fundamental "data sparseness" problem. We see a photo of two people in Paris on Monday and another on Thursday, but were they together for the whole week?
The authors argue that Online Social Networks (OSNs) act as Soft Sensors. Unlike physical GPS trackers, soft sensors rely on human-governed data (manual tags and uploads). The core challenge is addressing the uncertainty of these events: users are "noisy" sensors who post irregularly.
The DST Methodology: Physical Intuition Meets Machine Learning
The DST algorithm operates on a fascinating intuition: Distance dictates duration. In the travel industry, the further you go, the longer you stay.
1. The Multi-Source Fusion
The framework merges three data types:
- Social Metadata: Timestamps and "With whom" tags.
- Geographical Profiles: Hometown vs. Current City.
- External Knowledge: A dataset of 174 commercial tour packages to establish a distance-to-duration baseline.
2. Architecture & The Effective Distance ()
The algorithm calculates an "effective distance" () by averaging the proximity of the event to both users' homes. It then maps this distance to a duration () using two competing methods:
- Linear Regression (LR): A simple functional mapping.
- Non-Uniform Segmentation (NUS): Dividing distances into empirical buckets (e.g., 105–253km 1.25 days).
 Note: The algorithm uses Algorithm 1 to filter F2F interactions and merge duplicate events based on a temporal threshold ().
3. Merging Fragmented Events
The most "intelligent" part of the DST algorithm is the Gamma () Tuning. If two photos are taken at the same location within days, they are merged into a single "trip." Through experimentation, the authors found that provides the optimal balance between merging fragments and separating distinct visits.
Experimental Performance: Beyond Simple Counting
The authors tested DST on 90 Facebook user pairs, comparing it against a ground-truth survey where users reported their actual time spent together in 2013.
Key Findings:
- NUS vs. LR: Non-Uniform Segmentation (NUS) significantly outperformed Linear Regression. The relative error for individual events dropped from 34.08% (LR) to 11.34% (NUS).
- The "Sparsity" Correlation: As expected, there is a strong negative correlation between the number of shared interactions and estimation error. The more you post, the more accurate the DST becomes.
- The "Vacation" Peak: Accuracy is highest (approx. 84%) for events outside the user's home city, as these follow predictable travel patterns learned from the tour package data.
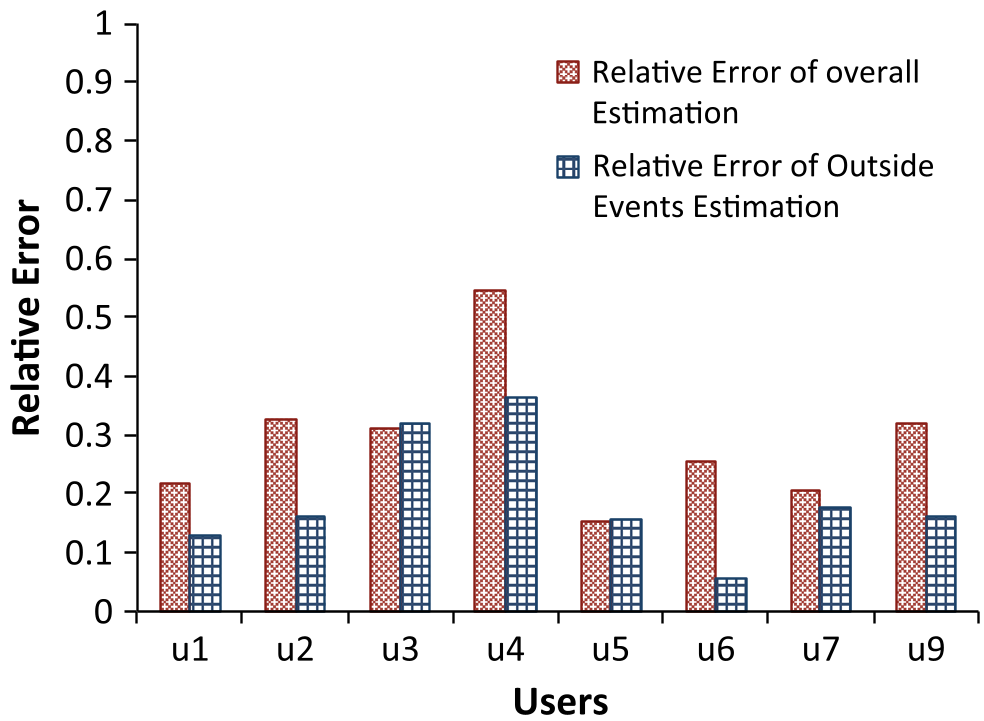 The chart above illustrates how DST (NUS) tracks the ground truth much more closely than the "Previous Work" which merely counted interaction days.
Critical Insight: Why This Matters
The value of DST isn't just in "counting days." It provides a metric for Tie Strength. In the world of AI recommendations, knowing that a user spent 14 days in a remote cabin with a friend is a much stronger signal of influence than 100 "likes" on a profile picture.
Limitations & Future Work
- Route Blindness: The current version struggles with multi-stop trips (e.g., a European tour), often overestimating duration by treating each city as a separate event.
- Metadata Privacy: The algorithm relies heavily on metadata, which some platforms (like Facebook) are increasingly stripping for privacy reasons.
Conclusion
DST represents a shift from "Social Graph" analysis (who is connected to whom) to "Social Living" analysis (how do these connections manifest in time and space). As we move toward more personalized digital assistants, algorithms that can infer our real-world intimacy from sparse digital breadcrumbs will become the backbone of context-aware services.