
Analyzing the DNA of Digital Neighborhood Watches: Insights from ManyNets
18936_The Dynamics of Web-Based Community Safety Groups Lessons Learned from the Nation of Neighbors [Social Sciences].
This paper presents a visual analytics study of online neighborhood crime watch communities using "Nation of Neighbors" (NON) data. Utilizing the ManyNets tool, the researchers defined novel metrics for community health and leadership to identify determinants of successful growth and member participation.
TL;DR
Building a successful online community is more than just providing a platform; it requires understanding the hidden levers of growth and leadership. By analyzing the Nation of Neighbors (NON) platform through the lens of a visual analytics tool called ManyNets, researchers have mapped out how neighborhood crime-watch groups evolve. The key finding? Community success is driven by "Super-Leaders" who pivot the group from recruitment to active safety reporting once a critical mass is reached.
Background: Beyond the Traditional Watch
Neighborhood watch programs have existed since the 1970s, but their effectiveness often fades as initial enthusiasm wanes. The transition to the Web (via platforms like NON) provides a digital paper trail of community dynamics. However, community managers have historically lacked the tools to see the "big picture"—struggling to distinguish between a thriving group and a stagnant one.
The Problem: The Fog of Community Management
Why do some neighborhood groups vanish while others become vibrant hubs of safety? Most social network analysis (SNA) tools focus on single, massive networks (like Facebook). There is a significant gap in tools designed to compare hundreds of small, independent communities simultaneously to find patterns of success.
Methodology: The ManyNets Approach
The researchers utilized ManyNets, a tool that treats networks as rows in a table. This allows for rapid sorting and filtering based on custom metrics.
1. Quantification of Success (Health Metrics)
The team defined Interaction Intensity (), which measures activity relative to the "age" of the community in member-months:
2. Identifying the "Super-Leader"
They moved beyond simple "most active" lists by creating a Leadership Metric (). A leader is defined as someone whose activity level () is more than two standard deviations () above the community mean ():
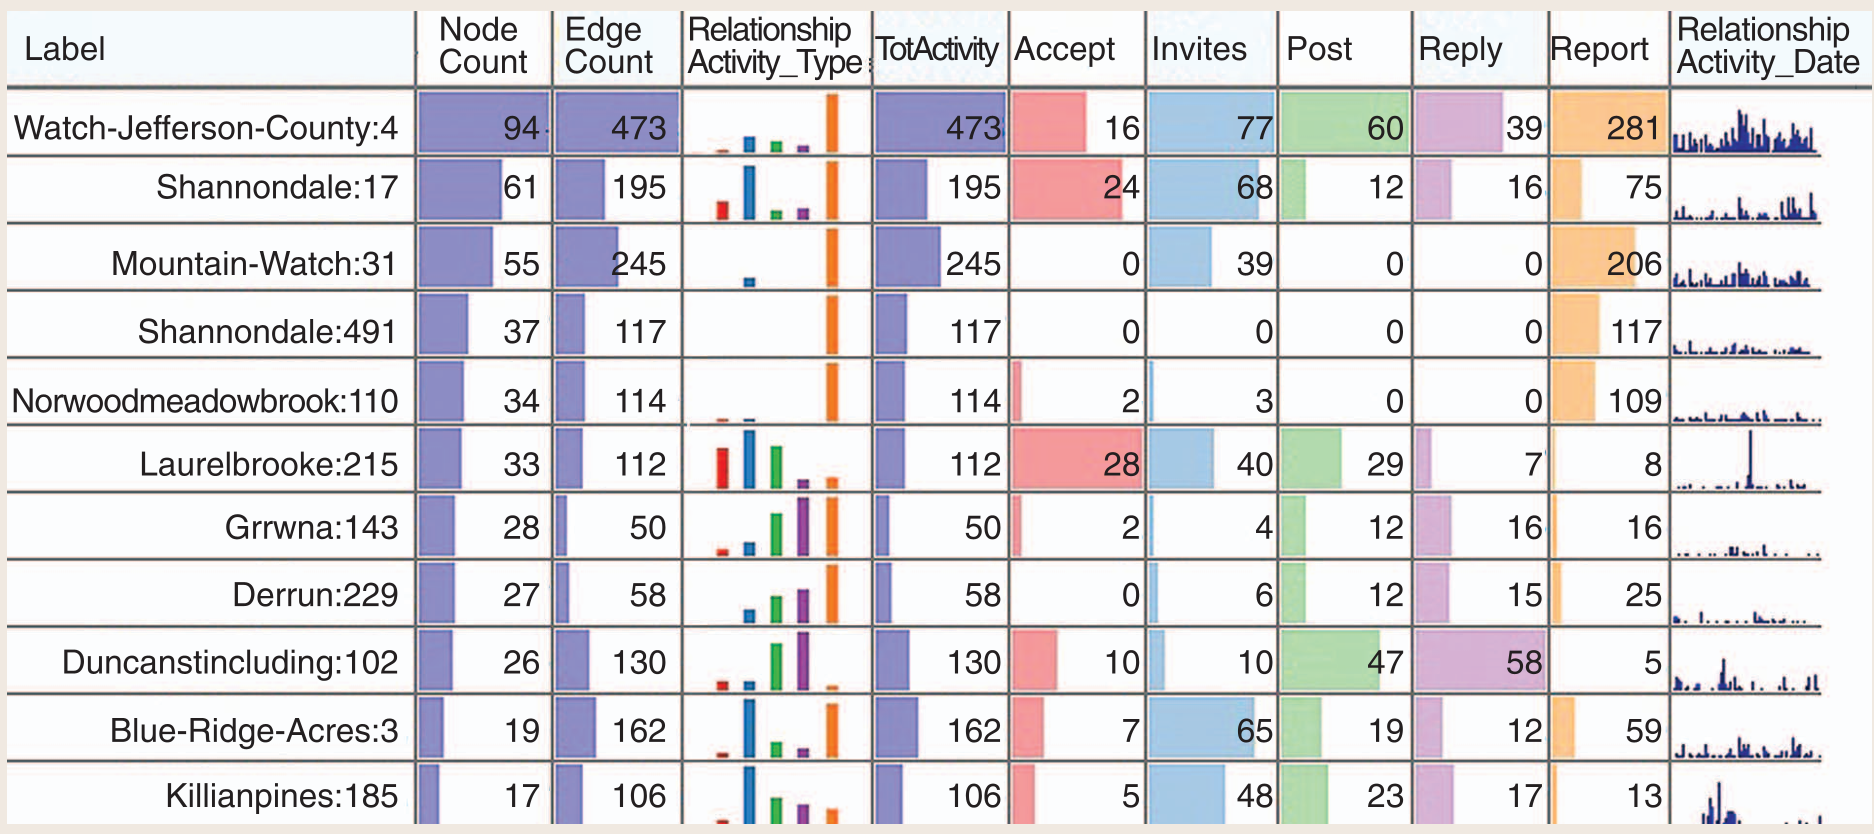 Figure 1: The tabular interface of ManyNets allows managers to compare community health metrics side-by-side.
Key Insights: What Makes a Community Tick?
Invitations vs. Reports
By analyzing temporal patterns, the study found a clear evolutionary path:
- Phase A (Growth): Leaders dominate the activity, primarily by sending invitations.
- Phase B (Maturity): Once a "critical mass" is reached, the community shifts. Invitations drop, and crime reporting (the ultimate goal) becomes the dominant activity.
The Myth of Law Enforcement Vitality
A surprising finding was that the presence of law enforcement officers was not a predictor of community success. Successful groups were largely self-organized by highly active civilian residents (leaders) who acted as "recruitment engines."
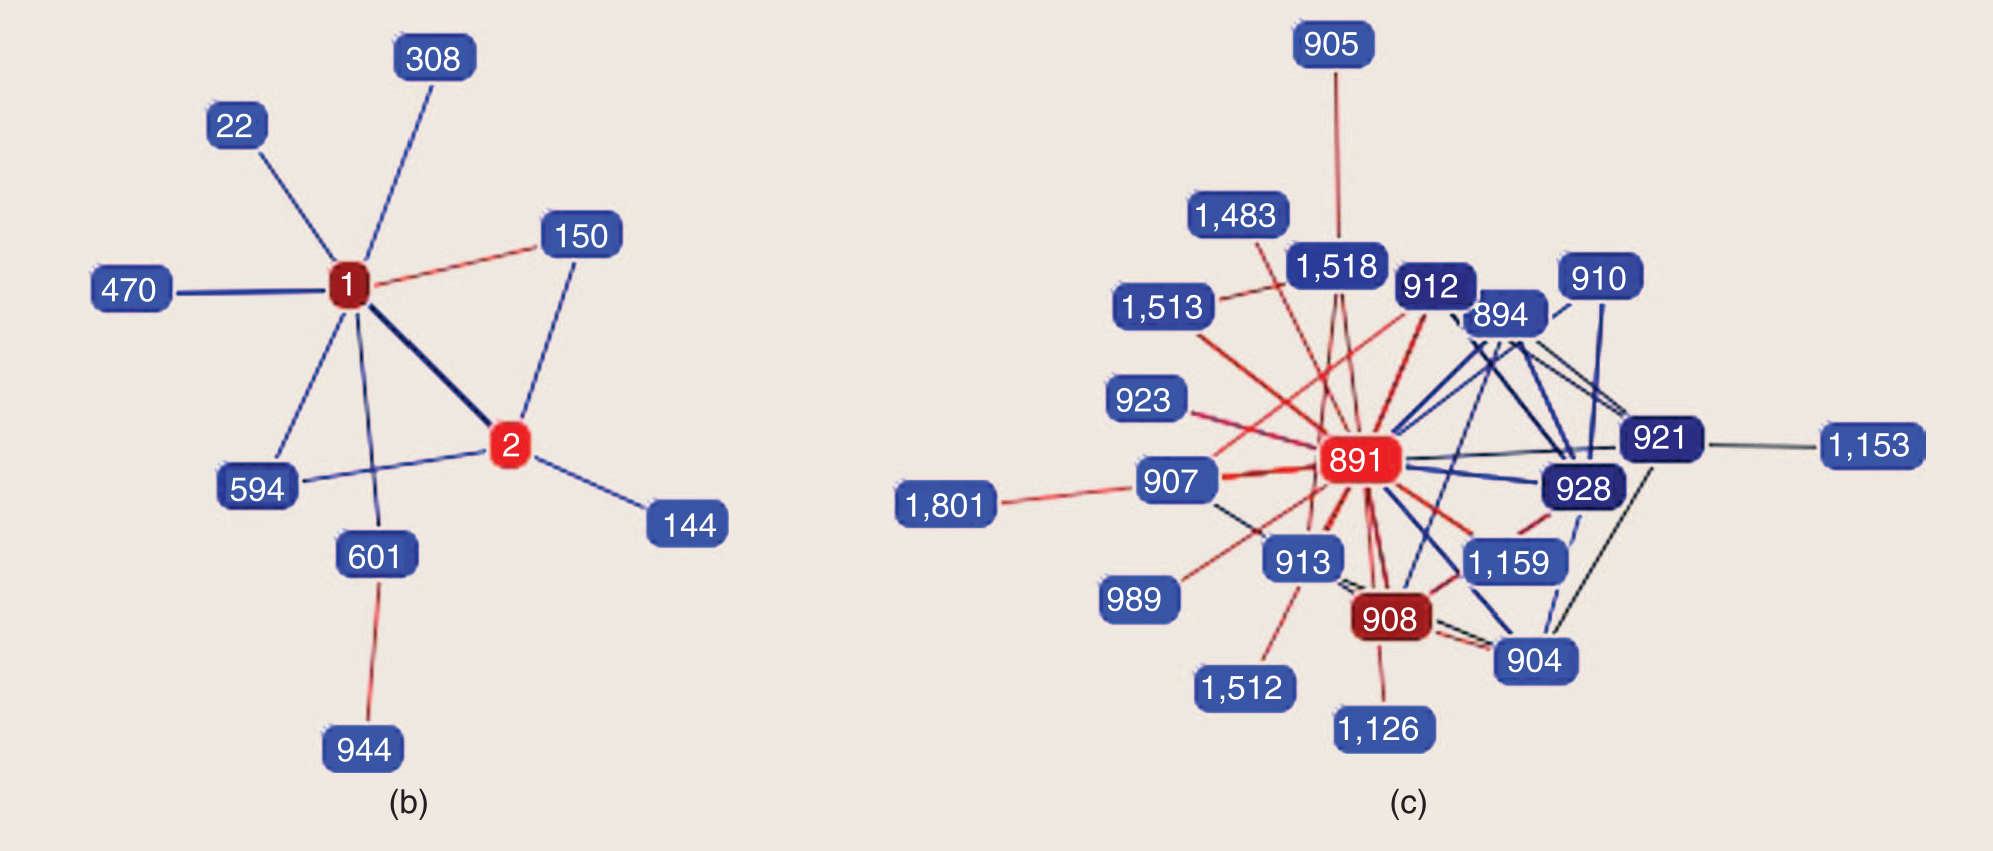 Figure 2: Ego networks showing how a single leader (red node) connects and drives the activity of the broader community.
Experimental Results
The researchers filtered 230 communities down to 44 high-performing ones. In these groups:
- Reports surpassed Invitations only in larger, more mature communities.
- 16 out of 44 successful communities had at least one clear "Leader" identified by the metric.
- Temporal analysis showed that when leaders engaged in discussions (posts/replies), it directly boosted the participation of other members in those specific activities.
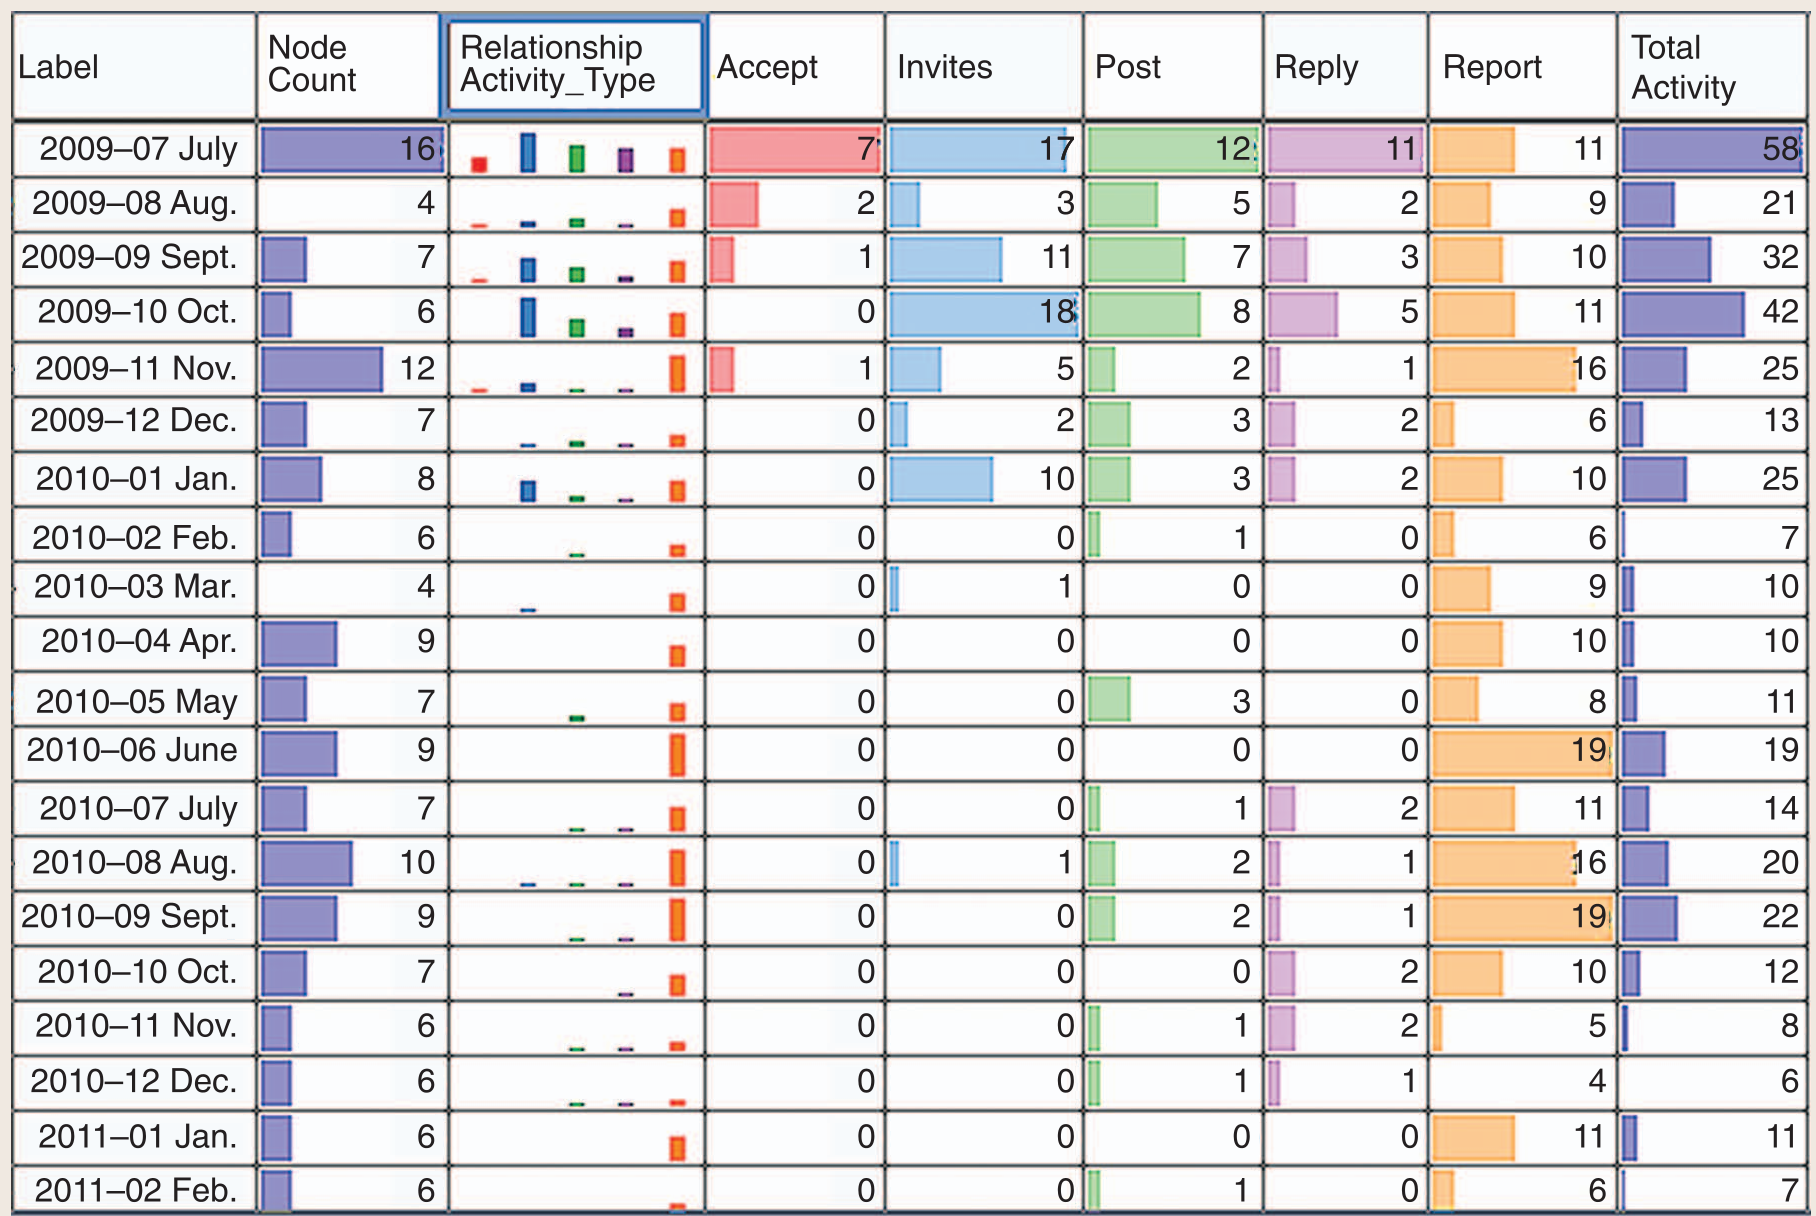 Figure 3: A month-by-month breakdown showing the shift from recruitment (invitations) to sustained safety reporting.
Critical Insight: The Manager’s Playbook
This research confirms that online safety communities are fragile. The takeaway for platform designers is clear: Target the leaders. If a platform can identify and support "super-users" early on, they will handle the heavy lifting of recruitment. Once the group reaches a threshold size, the community naturally transitions into the functional "watchdog" role intended by the platform.
Conclusion & Future Work
The use of visual analytics like ManyNets transforms raw activity logs into actionable hypotheses. Future iterations of such tools could potentially suggest interventions—for example, alerting a manager when a community's leader becomes inactive, or suggesting when to pivot from recruitment-focused features to reporting-focused features.