
Beyond the Viral Curve: Why Network Communities are the Pulse of Social Diffusion
Early warning analysis for social diffusion events
This paper addresses early warning systems for social diffusion by examining how network community structures impact the spread of ideas and pathogens. It introduces two hypotheses focused on inter-community links and early cross-community dispersion, validated through case studies on the Swedish Social Democratic Party, SARS, and global blog dynamics.
TL;DR
Predicting which social movements or epidemics will explode and which will fizzle out is notoriously difficult. This paper argues that the secret isn't in the volume of initial activity, but in its dispersion. By monitoring how a signal jumps across "network communities"—densely connected groups with few outside links—researchers can identify self-sustaining mobilization events weeks before they peak.
Contextual Positioning
While most 2010-era research focused on "influentials" or "intrinsic quality," Colbaugh and Glass shift the focus to Topological Inductive Bias. They position their work at the intersection of statistical physics and social dynamics, proving that the architecture of a network dictates its capacity for massive diffusion.
The "Intrinsic" Fallacy vs. The Community Insight
Standard predictive models assume that if something is "good" or "dangerous," it will naturally spread. However, empirical studies show that "intrinsic" characteristics have surprisingly low predictive power.
The authors' core insight is that Community Structure—the tendency of social networks to form tight clusters—acts as a barrier to diffusion. Therefore, the most critical "early warning" isn't the total number of infected individuals or blog posts; it is the presence of the signal in multiple, disparate communities.
Methodology: Entropy as a Signal
The researchers utilize Modularity-based partitioning to map communities. The math relies on a matrix where , identifying partitions that have more internal edges than a random graph would suggest.
The Secret Sauce: Post/Community Entropy (PCE)
To quantify early dispersion, they introduce PCE: Where is the fraction of activity in community . A high PCE means the discussion is distributed across many different social groups, signaling a "triggering" event that is likely to go viral.
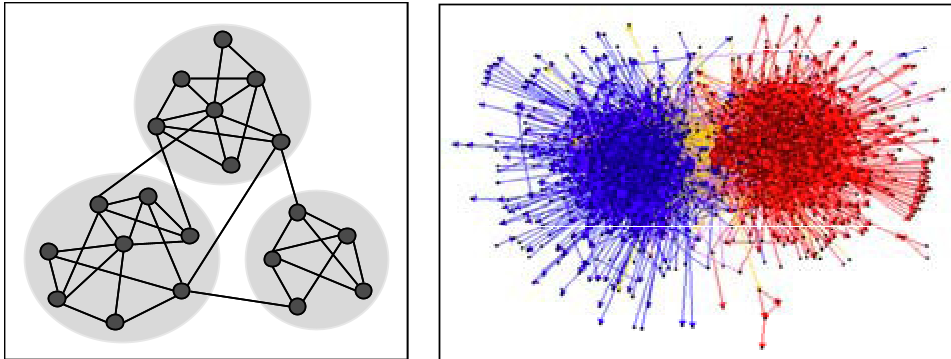 Figure 1: Visualizing how liberal and conservative blogospheres form distinct communities.
Case Study: The Swedish SDP and SARS
The authors validated their first hypothesis—that even a few inter-community links are powerful predictors—by looking at the Swedish Social Democratic Party (1889-1918). They found that membership growth in remote communities connected by party activists was a better predictor of local growth than membership in physically adjacent districts.
In the SARS study (2002-2003), they treated countries as communities and air travel routes as inter-community links. By prioritizing the accuracy of these long-distance "bridges" over local transmission details, they achieved a high-fidelity simulation of the epidemic's global path.
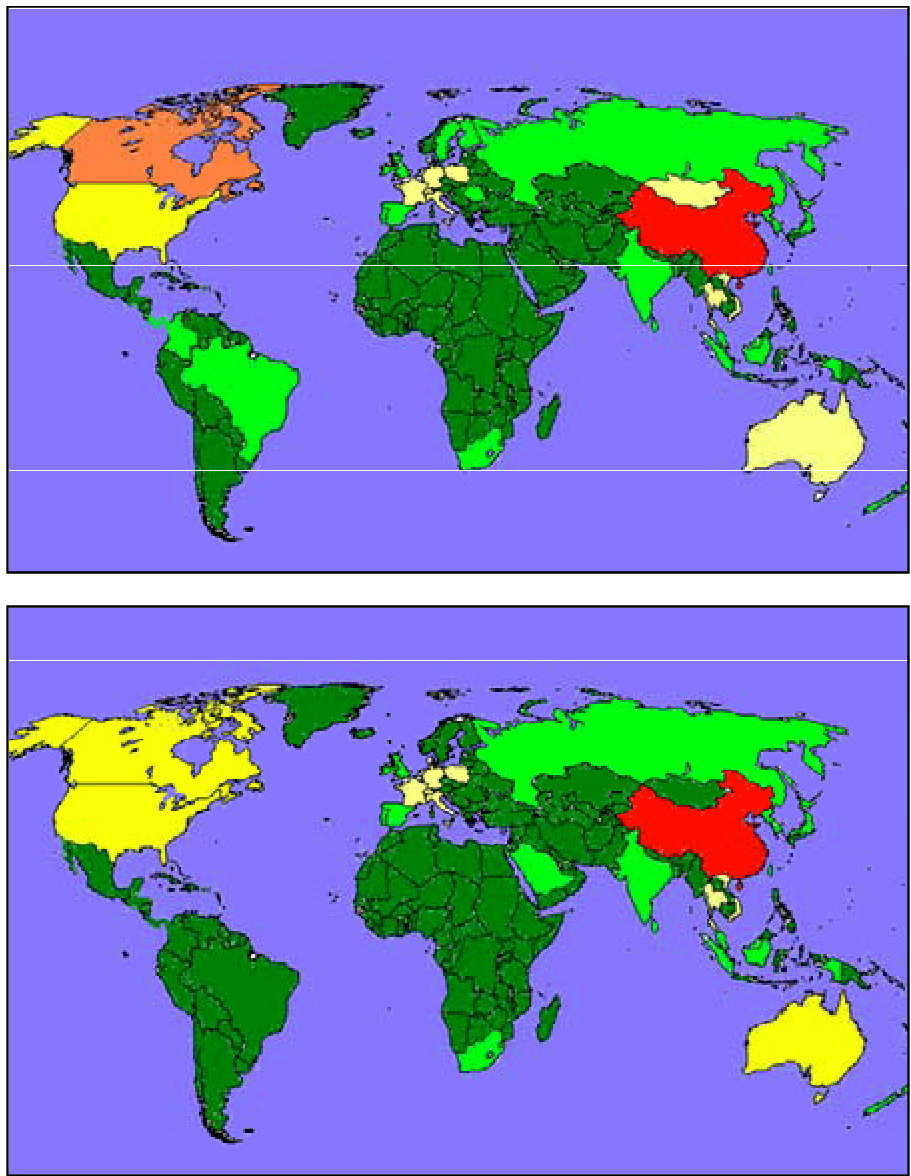 Figure 2: Actual vs. Simulated SARS infection levels, highlighting travel-based inter-community diffusion.
Predicting Protests: Entropy vs. Volume
Perhaps the most impactful result comes from the analysis of Muslim mobilization events (e.g., the Jyllands-Posten cartoons).
- Volume-based indicators (Red curves in Fig 4) failed. They often spiked after the mobilization was already massive or stayed high without leading to violence.
- Entropy-based indicators (Blue curves in Fig 4) succeeded. A dramatic increase in PCE occurred weeks before the increase in volume and subsequent violence.
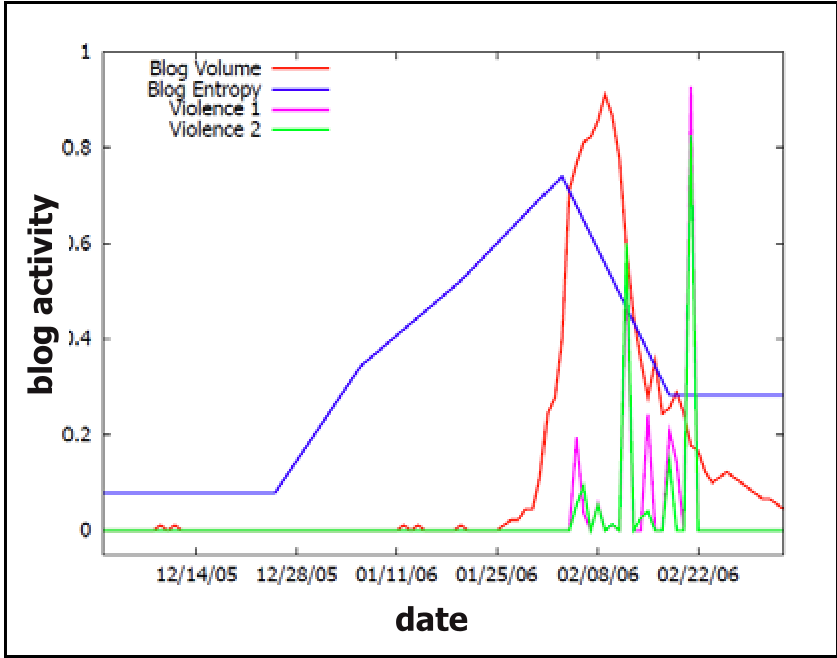 Figure 3: In the Danish cartoons event, the Blue Entropy curve (PCE) spikes well before Volume (Red) or Violence, providing a critical lead time.
Critical Analysis & Conclusion
This work provides a robust mathematical foundation for what we now intuitively understand about "echo chambers." Its primary strength is the move from simple magnitude to structural diversity.
Limitations: The study assumes that community boundaries are relatively stable and that blog/travel data are sufficient proxies for real-world interaction. In the age of algorithmic feeds, community boundaries may be more fluid and harder to map using modularity alone.
Future Outlook: For today's platform moderators and security analysts, the takeaway is clear: stop looking at the trending count. Look at how many different social types are talking about a topic. That is the true measure of a "trigger" event.