
Decoding the Pulse of Learning: How "Time Between Actions" Reimagines Course Management
Educational data mining and data analysis for optimal learning content management: Applied in moodle for undergraduate engineering studies
This paper introduces an Educational Data Mining (EDM) framework that utilizes the Time Between Actions (TBA) of learners on the Moodle platform to model user behavior. By fitting asymmetric Probability Density Functions (PDFs) to TBA data and using their parameters for k-means clustering, the study successfully categorizes learning modules into distinct "characters" based on student interaction patterns.
TL;DR
Can the silence between your mouse clicks reveal how well you are learning? This research explores Educational Data Mining (EDM) by analyzing the Time Between Actions (TBA) on e-learning platforms. By fitting complex mathematical distributions to these time intervals, the authors successfully clustered course modules into groups that reflect student engagement levels, providing a data-driven roadmap for instructors to optimize their content.
The Motivation: Moving Beyond Grades
In the world of e-learning, "Big Data" is often reduced to "Final Grades." However, a grade only tells you the result, not the process. The authors argue that the rhythm of student interaction—how long they pause between a scroll and a click—contains a "hidden signature" of their emotional and cognitive state.
The core challenge is that this pulse is non-linear and "noisy." Previous works relied on intuition, but this paper seeks a rigorous statistical foundation: can we find a mathematical "law" that governs how students navigate Moodle?
Methodology: Mining the Temporal Signature
1. The Logger API
The researchers developed a custom API for Moodle to capture three distinct events:
- Mouse Clicks
- Screen Scrolls
- Page Loads
By subtracting successive time stamps, they calculated the TBA, discarding any interval longer than 5 minutes to filter out "inactive" sessions.
2. Statistical Modeling (The "How")
The team tested three heavy-tailed probability distributions to see which one best mirrored the student experience:
- Exponential: The simplest model for random arrival times.
- Log-normal: Often used to model human reaction times.
- Gamma: A flexible distribution for skewed data.
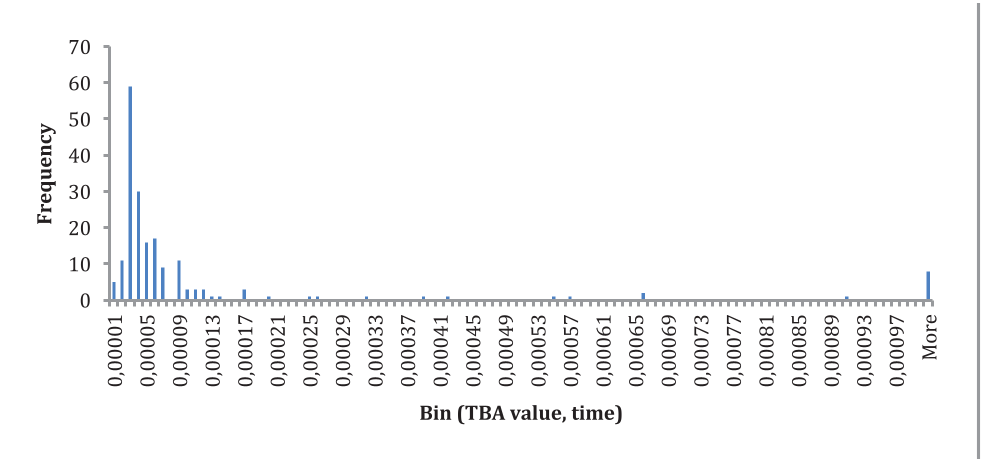 Figure: Frequency histograms of TBAs showing the characteristically skewed distribution of student interactions.
Experiments & Results: The Power of the Log-Normal
Using Maximum Likelihood Estimation (MLE), the research proved that the Log-normal distribution optimally fits the TBA data. This is a critical finding because it bridges the gap between EDM and general Web 2.0 behavior, suggesting that "learners" aren't a separate category of web users—they follow universal patterns of digital exploration.
Clustering Content "Character"
By using the 5 parameters from these distributions as a feature vector, the authors applied k-means clustering. The results were illuminating:
- Cluster 1 (Sections C, M): Characterized by super-short TBAs. These sections lacked quizzes, leading to what authors call "nervous" or superficial interaction.
- Cluster 2 (Sections A, E, G, K, P, R, T): Featured longer TBAs and higher focus. Every one of these sections contained an evaluation quiz.
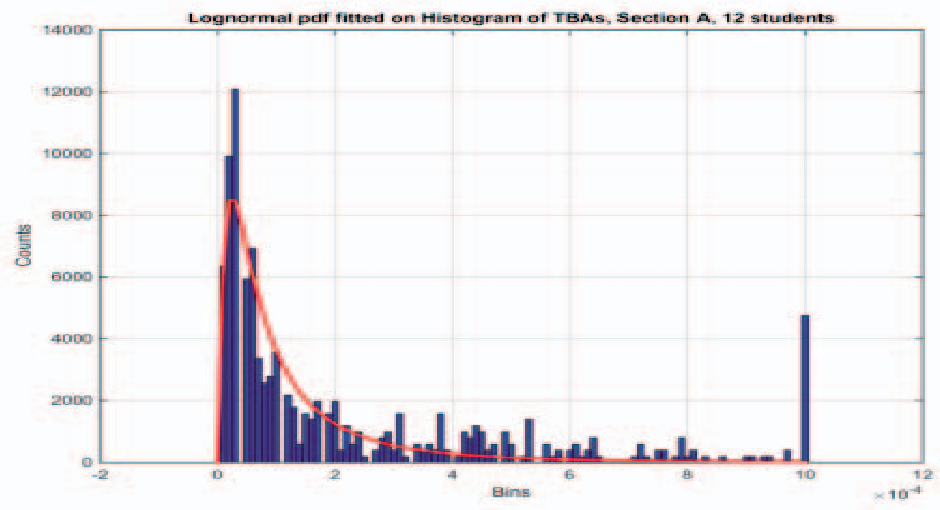 Figure: Comparison of PDF fitting. The alignment between the red PDF curve and the blue histogram validates the use of distribution parameters as reliable features.
Critical Analysis & Conclusion
The value of this work lies in its Inductive Bias: it assumes that the structure of the time spent is more telling than the total volume of time.
Key Takeaway
If you want to know if a course module is "working," don't just look at how many people clicked it. Look at the distribution of their pauses. A shift toward shorter, more erratic TBAs is a red flag for a "passive" or "unfocused" learning module.
Future Outlook
While the study is small (90 students), it paves the way for Adaptive LMS (Learning Management Systems). Imagine a Moodle that detects "superficial interaction" in real-time and automatically injects a quick-fire quiz or an interactive element to pull the student back into deep focus. This is the future of optimal learning content management.