
SVR vs. NPQR: Pinpointing School Dropout Risks via Educational Data Mining
Educational Data Mining: An Application of Regressors in Predicting School Dropout
This paper presents an Educational Data Mining (EDM) study applying Support Vector Regression (SVR) and Nonparametric Quantile Regression (NPQR) to predict school dropout rates in Brazil. Utilizing data from INEP, the study identifies critical socio-structural factors and demonstrates that SVR achieves superior predictive accuracy (SOTA in this specific context) over NPQR.
TL;DR
School dropout is a multifaceted crisis impacting Brazil's social and economic development. This study leverages Educational Data Mining (EDM) to move beyond simple statistics. By applying Support Vector Regression (SVR) and Nonparametric Quantile Regression (NPQR) to the INEP database, the researchers found that school infrastructure—particularly technological resources—serves as a primary predictor for student desertion, with SVR emerging as the more robust predictive tool.
Background & Motivation: Moving Beyond Linear Models
While previous studies on school dropout have utilized Decision Trees or Neural Networks, the educational landscape is often "noisy" and non-linear. Standard linear regressions often fail to capture the nuances of schools in diverse geographic locations. The authors argue that non-parametric techniques offer the flexibility needed to model these complexities without being constrained by rigid assumptions about data distribution.
Methodology: The CRISP-DM Approach
The study follows the CRISP-DM (Cross-Industry Standard Process for Data Mining), ensuring a systematic transition from business understanding to deployment.
1. Feature Engineering with Random Forest
Before training the regressors, the authors used Random Forest to rank variable importance. Out of 166 variables in the School Census, nine were selected as high-impact features:
- Infrastructure: Total rooms, administrative and student computers.
- Human Resources: Total number of employees.
- Contextual: School location (Urban vs. Rural) and presence of basic sanitation/water sources.
2. The Contenders: NPQR vs. SVR
- NPQR: Uses a Gaussian Kernel to estimate the 0.5 quantile (median). It allows for a flexible view of relationships but is highly sensitive to the "bandwidth" parameter.
- SVR: Aims to find a hyperplane in a high-dimensional space that fits the data within a certain margin (). By using the Radial Basis Function (RBF) Kernel, it handles non-linear patterns effectively.
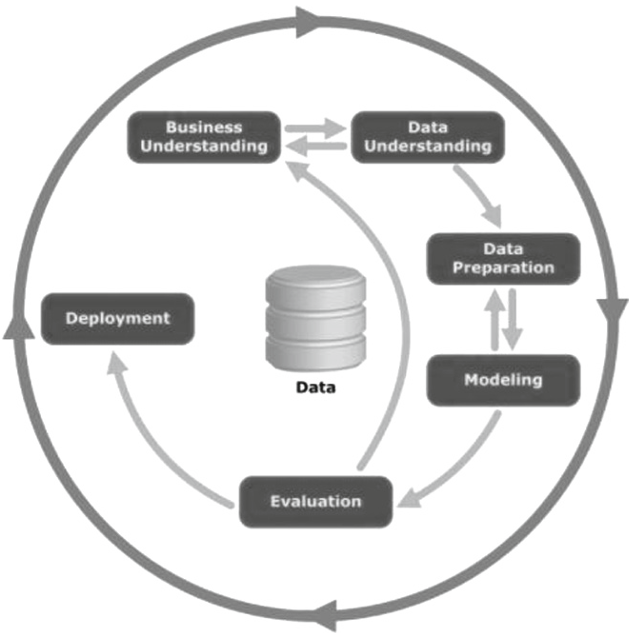 Figure 1: The CRISP-DM workflow used to structure the research.
Experimental Performance
The experiments involved 30 independent simulations for each model to ensure statistical significance, measured by the Mean Absolute Error (MAE).
| Technique | Mean Error (MAE) | Standard Deviation |
|---|---|---|
| SVR | 0.015665 | 0.0 |
| NPQR | 0.0223757 | 0.00324569 |
Why SVR Won
The analysis reveals two main reasons for SVR's dominance:
- Global Optimization: Unlike many iterative methods, SVR is designed to find a global optimum, making it more reliable for the specific distribution of the INEP data.
- Kernel Efficiency: The RBF kernel in SVR was better at mapping the structural features (like computer counts) to dropout rates than the bandwidth-dependent NPQR.
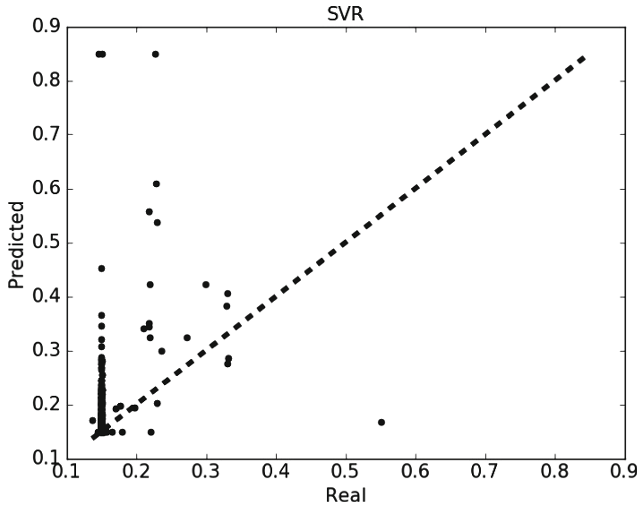 Figure 2: Visual inspection of SVR prediction vs. real values (lower plot), showing high concentration around the target line.
Academic Insight: The "Hidden" Predictors
The correlation matrix yielded a surprising insight: School Location (TLD) and Water Supply (IAF) had a correlation coefficient of 0.35 with dropout. This highlights that in Brazil, the physical environment and basic accessibility are often just as influential as academic performance in determining whether a student stays in school.
Critical Analysis & Conclusion
Takeaway
This research underscores that Support Vector Regression should be a preferred baseline for educational regression tasks due to its stability and high accuracy. Furthermore, it validates that "soft" infrastructure (computers) and "hard" infrastructure (facilities) are critical indicators of institutional health.
Limitations & Future Work
The high correlation between features like room count and employee count suggests that multicollinearity might exist, which could be further addressed using PCA (Principal Component Analysis). Future research could expand this model to a temporal "Time-Series" analysis to see how dropout risks evolve over a decade rather than a single year.