
Enhancing EEG Emotion Recognition: The Power of Baseline Calibration Strategy
EEG Emotion Classification Based On Baseline Strategy
This paper introduces a novel Baseline Strategy for EEG-based emotion classification, aimed at reducing experimental noise by calibrating individualized features. By identifying and replacing low-correlation baseline segments with a statistically-derived "new-baseline," the method achieves SOTA-level improvements on the DEAP dataset using both SVM and CNN classifiers.
TL;DR
Researchers have developed a Baseline Strategy that filters and replaces "noisy" or "abnormal" pre-trial EEG signals to improve emotion classification. By focusing on the correlation between 40 different baselines within a single subject, the method removes experimental errors, leading to a significant accuracy boost in both SVM and CNN-based models on the DEAP dataset.
The "Zero" Problem: Why Baselines Matter
In EEG studies, the baseline is the "quiet" period before a stimulus (like a music video) begins. While most researchers focus on the 60 seconds of emotional data, the 3-second pre-trial baseline is often neglected or used blindly.
The core Insight of this paper is that since a single participant's personality remains constant across sessions, their baselines across 40 trials should be highly correlated. If a specific trial's baseline looks vastly different from the others, it is likely an "outlier" caused by electrode movement or experimental error, which subsequently "taps" the rest of the emotional data with incorrect calibration.
Methodology: Correlation-Based Filtering
The proposed strategy follows a rigorous statistical path to "clean" the reference signal:
- Pearson Correlation: Calculate the correlation between the PSD of the baseline for each trial.
- Thresholding: Identify "High-Correlation" baselines (where the ratio of highly correlated channels is > 0.75).
- Synthetic Calibration: Replace the "Low-Correlation" (abnormal) segments with a "New-Baseline" derived from the average of the high-quality ones.
- Feature Correction: Use this refined baseline to calibrate the Power Spectral Density (PSD) of the actual emotional task data.
 The Pearson correlation formula used to determine the similarity between baseline segments.
Two-Tiered Validation: SVM and CNN
The authors validated their strategy across two distinct technical pipelines:
- Statistical Features + SVM: Extracting Kurtosis, Skewness, and Fractal Dimensions from the calibrated PSD bands.
- Deep Learning + CNN: Using Short-Time Fourier Transform (STFT) to create a "PSD Stream," which is then processed by a 5-layer CNN with a majority voting mechanism for the final decision.
Experimental Results & Performance
The results prove that "cleaning the anchor" works. Across the board, the baseline strategy outperformed the standard "No Baseline" approach.
Key Performance Metrics:
| Task | Without Strategy | With Baseline Strategy | Improvement |
|---|---|---|---|
| Valence (SVM) | 74.83% | 75.62% | +0.79% |
| Arousal (SVM) | 76.32% | 79.54% | +3.22% |
| Valence (CNN) | 79.92% | 81.14% | +1.22% |
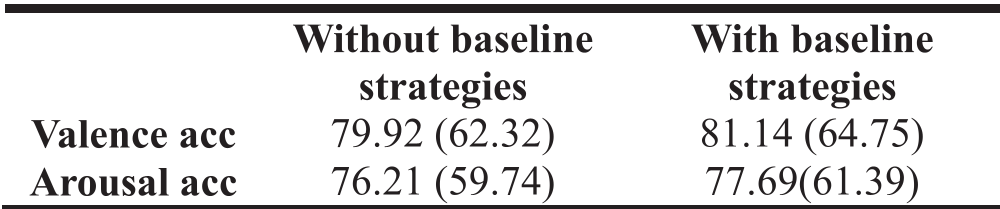 Comparison of CNN performance shows that even with advanced deep learning, the baseline strategy provides a crucial edge.
Critical Insight: Why Arousal Benefited More?
Interestingly, the Arousal dimension saw a higher jump in accuracy (+3.22%) than Valence. This suggests that the physiological "activation" (Arousal) is more sensitive to baseline shifts than the "pleasantness" (Valence) of an emotion. The fractal dimension and statistical features of the PSD seem to capture these intensity changes more effectively once the noise floor (baseline) is stabilized.
Conclusion & Future Outlook
This paper demonstrates that in the quest for SOTA accuracy, we shouldn't just look for "better models" but also "better data hygiene." By acknowledging that the baseline is a personalized, high-correlation anchor, we can calibrate sensors more effectively. The authors plan to extend this to broader datasets to see if this "personality-consistent" baseline theory holds across different recording environments.