
Evaluating Agricultural Informatization: Beyond Absolute Levels to Resource Efficiency
Efficiency Evaluation of Agricultural Informatization Based on CCR and Super-Efficiency DEA Model
This paper evaluates the input-output efficiency of Agricultural Informatization (AI) in Hunan Province, China, using CCR and Super-efficiency DEA models. By analyzing a 9-index system across two regions (Huaihua and Xiangxi) from 2009 to 2013, the study identifies temporal efficiency trends and investment redundancies.
TL;DR
This research shifts the focus of Agricultural Informatization (AI) from "how much technology we have" to "how efficiently we use it." By applying CCR and Super-efficiency DEA models to data from Hunan province (2009–2013), the study proves that even "underdeveloped" regions can achieve high input-output efficiency, though significant gaps remain in infrastructure popularity like Internet access.
Background & Motivation: The Efficiency Gap
In the rush to modernize rural economies, governments often invest heavily in ICT (Information and Communication Technologies). However, traditional metrics like the Machlup or Porat methods only measure the level of informatization. They fail to answer a critical economic question: Is this investment yielding proportional returns?
The authors argue that in regions with limited statistical data, a non-parametric approach like Data Envelopment Analysis (DEA) is superior because it identifies the "efficient frontier" without requiring a pre-defined production function.
Methodology: The DEA Framework
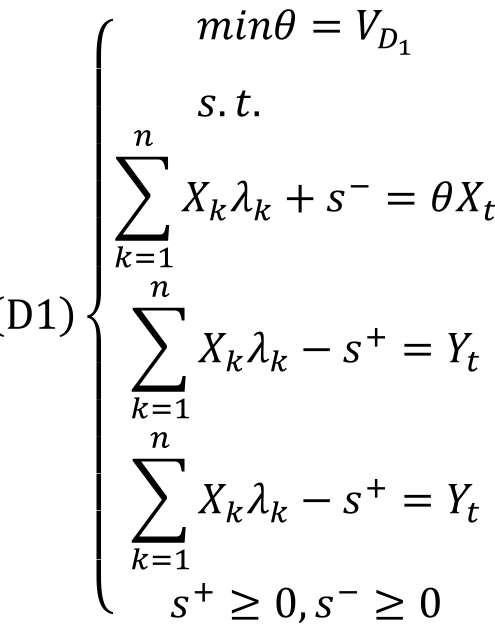
The core of the paper rests on two mathematical pillars:
- CCR Model: Evaluates the technical and scale efficiency of Decision Making Units (DMUs). If , the unit is on the frontier.
- Super-efficiency Model: Solves the "ranking problem." When multiple years or regions are "efficient" (), this model removes the DMU being evaluated from the reference set, allowing scores to exceed 100% for better differentiation.
The Index System
The authors selected 9 indicators to capture the multidimensional nature of rural ICT:
- Inputs (X1-X7): Post volume, rural electricity, telephone/cell phone subscribers, TV/Radio coverage, and Internet accounts.
- Outputs (Y1-Y2): Added value of agriculture and Farmers' per capita income.
Empirical Analysis and Results
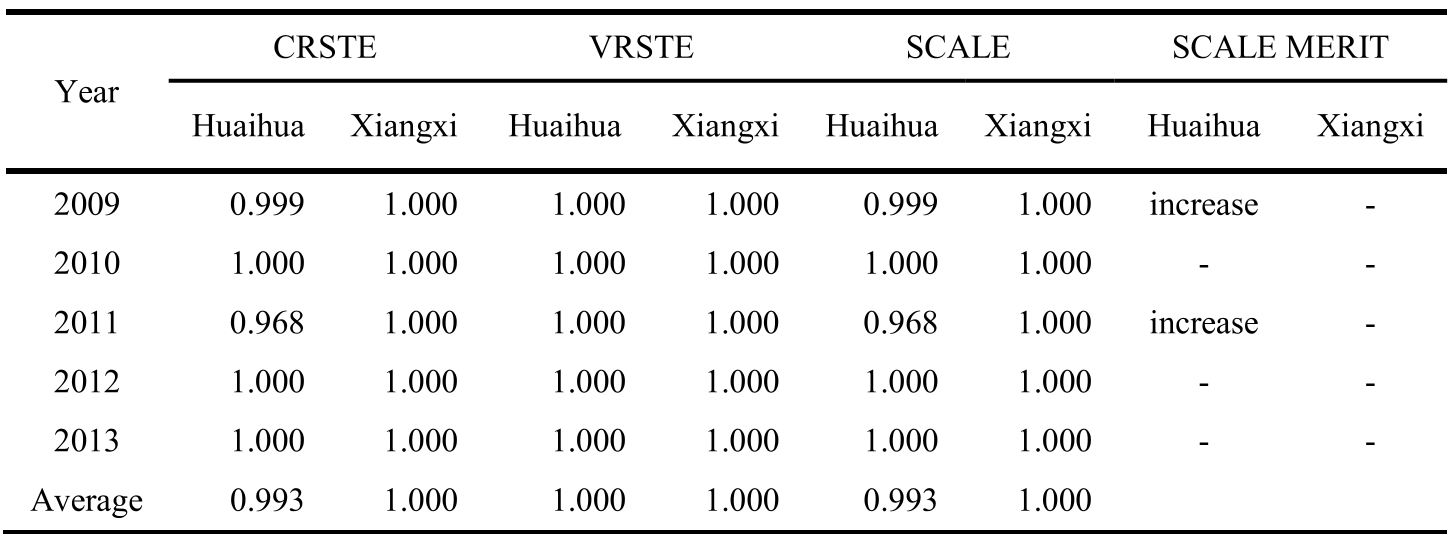
The study focused on Huaihua and Xiangxi. Despite their status as relatively underdeveloped areas, the results showed impressive stability.
Key Findings:
- Efficiency Stability: Xiangxi remained perfectly efficient () throughout the study period.
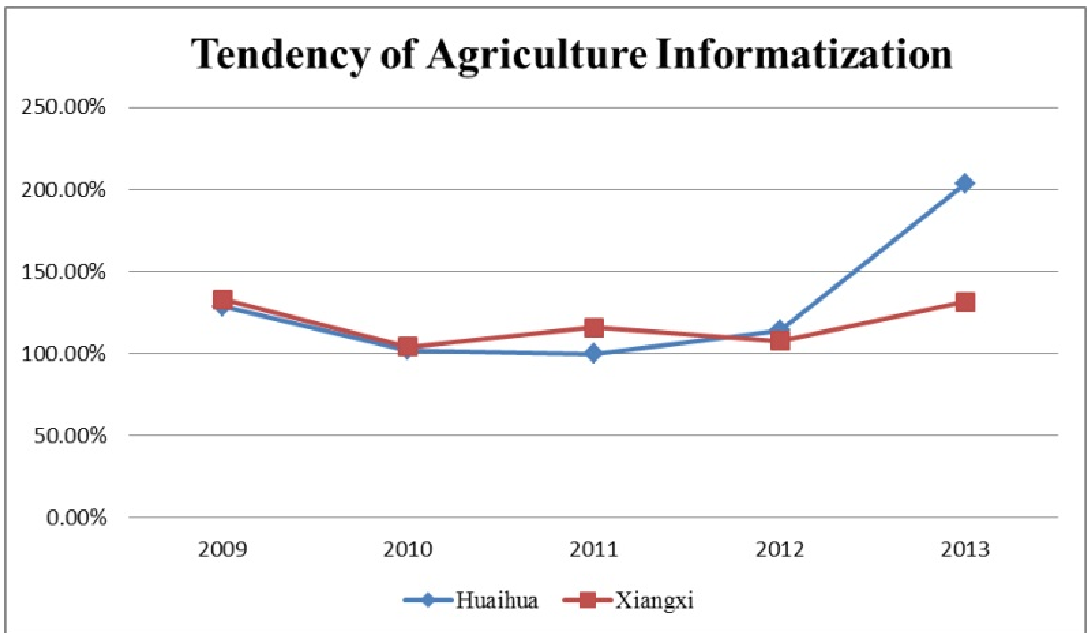
- Growth Potential: Huaihua's super-efficiency peaked in 2013 (203.68%), indicating a massive leap in the productivity of its AI investments.
- The 2009-2010 Dip: Both areas saw a temporary efficiency drop. In Huaihua, this was linked to an rapid increase in rural electricity consumption that didn't immediately translate to agricultural output. In Xiangxi, it was due to a decline in radio coverage.
Visualizing the Trend
The following figure highlights the divergent paths of the two regions. While Xiangxi stayed consistent, Huaihua showed more volatility but ultimately higher growth potential.
Critical Insight: Efficiency $
eq$ Development A vital takeaway from this research is the distinction between Efficiency and Development Level.
- Xiangxi is "efficient" because its small inputs are generating appropriate outputs.
- However, Xiangxi's absolute development (e.g., Internet penetration) is lower than Huaihua's.
This suggests that "Effectiveness" is a relative term. A region can be perfectly efficient but still suffer from a "digital divide" because its total investment scale is too small.
Conclusion & Future Outlook
The study successfully demonstrates that the CCR and Super-efficiency models are robust tools for regional AI evaluation. However, the authors acknowledge a major limitation: Data Availability. Local government statistics are often incomplete, particularly for emerging digital metrics.
For future policy, the message is clear: Optimize the scale. Increasing the "Internet popularity rate" is the next frontier for these regions to move from "efficiently poor" to "efficiently developed."