
Decoding the Corporate Social Fabric: Wearable Tech Meets Social Network Analysis
Using Embedded Technology Badges to Derive Social Networks, Patterns of Interaction and Space Utilization in a Corporate Headquarters
This study utilizes Hitachi's "Business Microscope" wearable sensor technology to objectively map social networks and space utilization within a corporate headquarters. By deploying infrared and accelerometer-equipped badges to 113 participants, the researchers successfully derived empirical interaction patterns and precise occupancy data across 19 departments.
TL;DR
How much time do your employees really spend collaborating, and which parts of your expensive headquarters are actually being used? This study moves past subjective surveys by deploying Hitachi’s "Business Microscope"—a wearable sensor system—to map the real-time social networks and space utilization of 113 employees. The result is a high-resolution, empirical map of organizational interaction that challenges traditional workstation management.
The Problem: The "Memory Gap" in Workspace Design
For decades, facility managers and workplace strategists have relied on a flawed instrument: human memory. Research shows that employees consistently overestimate the time they spend at their desks and misremember the frequency of their interactions.
When high-stakes real estate decisions—such as department relocations or floor-plan redesigns—are based on inconsistent observations or "gut feelings," the resulting environment often hinders rather than helps productivity. The core challenge is capturing objective, granular data without the intrusive eye of a human observer.
Methodology: The "Microscope" Approach
To bridge this gap, the researchers utilized a sophisticated IoT ecosystem:
- Individual Nodes (Badges): Worn by participants, these feature infrared senders/receivers and accelerometers to detect when two people are facing each other and interacting.
- Stationary Beacons: Placed in 25 meeting areas and 86 workstations to detect the presence of badges, thus measuring space utilization.
- Temporal Resolution: Data was sampled every 1.5 seconds, allowing for an incredibly detailed reconstruction of daily movements and social "collisions."
 Fig 1 & 2: The wearable badges (nodes) and the base station used for nightly data transfer and charging.
The study defined a meaningful interaction as a cumulative minimum of three minutes per day, distinguishing between "speakers" and "listeners" based on body movement patterns detected by the accelerometers.
Visualizing the Invisible: Social Networks and Space
The most striking output of this technology is the ability to visualize the "hidden" organization. While an org chart shows reporting lines, the Social Network Diagram (Fig 7) shows the actual flow of information and trust across three floors.
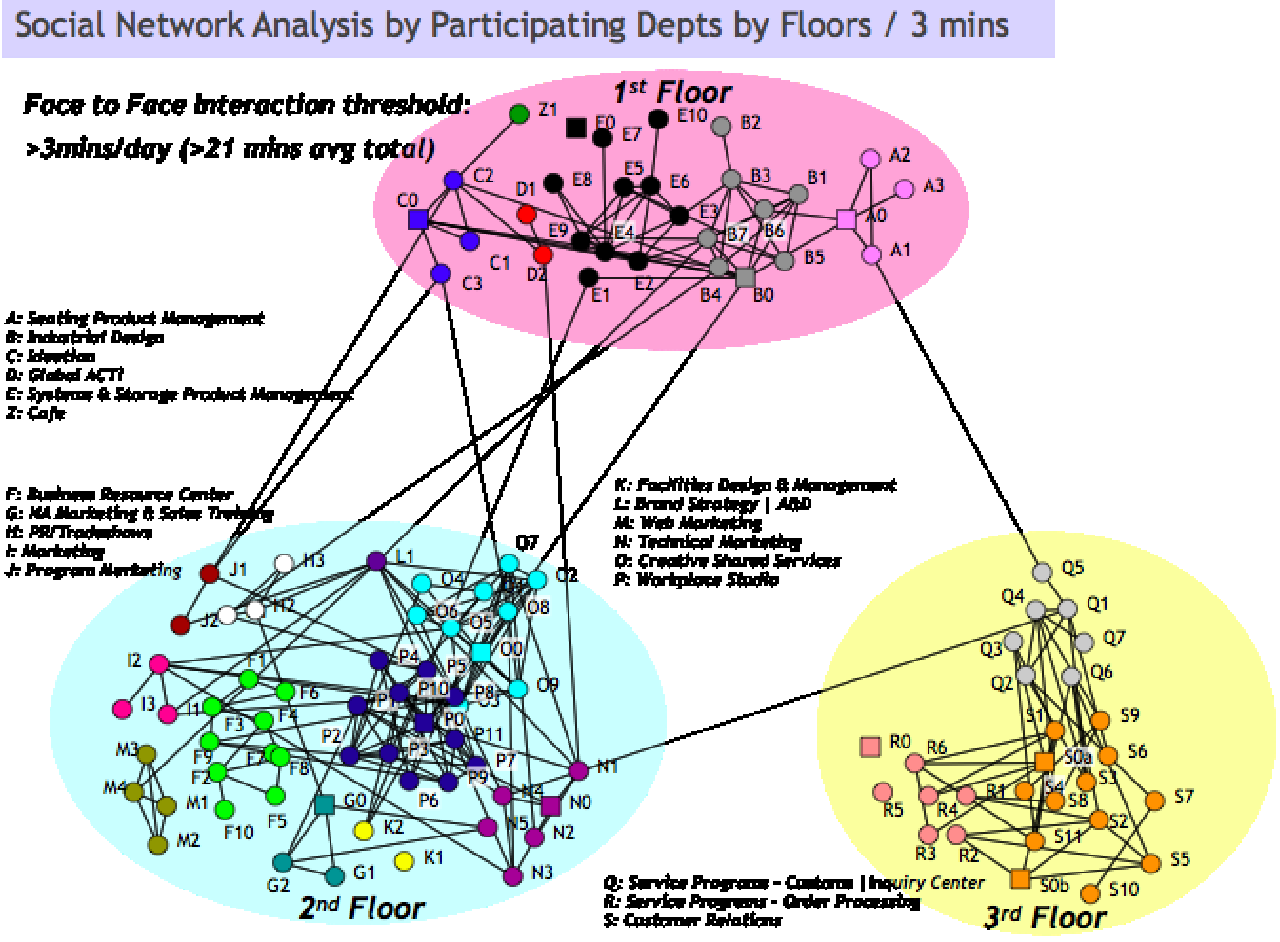 Fig 7: Empirical social networks derived from interaction data, revealing how departments bridge floor-level silos.
Key Findings:
- Collaboration Rates: The study identified significant variance in interaction intensity. For instance, "Creative Shared Services" showed a collaboration rate of 4.34, significantly higher than the overall Haworth average of 3.06.
- Space Under-utilization: By monitoring 86 individual workstations, the system provided objective evidence of which areas remained dormant, allowing for potential real estate consolidation.
 Fig 8: A localized view of interaction density compared to the physical utilization of space.
Critical Insight: Why This Matters
This study transitions Workplace Strategy from an art to a science. By using Social Network Analysis (SNA) as a proxy for organizational effectiveness, leaders can see if their physical environment is actually fostering the "serendipitous collisions" often touted as the goal of modern office design.
Limitations & Future Directions: The authors acknowledge that the current algorithms (specifically speaker/listener detection) were developed in Japan and may require cultural calibration for Western contexts. Furthermore, the technology currently cannot distinguish between "formal work talk" and "casual social talk." However, as a proof of concept, it demonstrates that wearable technology provides the predictive business intelligence that surveys simply cannot match.
Conclusion (Takeaway)
The future of office design isn't just about aesthetics; it's about topology. Understanding how humans physically connect and occupy space through empirical data is the first step toward creating high-performance work environments that actually support the social networks driving innovation.