
Living Green: Transforming Tourism through Social Network Analysis and Strength of Ties
Emerging Social Media and Social Networks Analysis Transforms the Tourism Industry: Living Green Smart Tourism Ecosystem
The paper introduces "Living Green," a Smart Tourism Ecosystem (STE) that leverages Facebook social computing to quantify and visualize inter-business connections. By applying the Strength of Ties theory and Gilbert’s social computing formula, it builds a recommendation engine for green tourism in Taiwan that optimizes for industry-wide synergy.
TL;DR
The "Living Green" project is a pioneering Smart Tourism Ecosystem (STE) that moves beyond simple travel apps. By mining Facebook interaction data and applying the Strength of Ties theory, it quantifies how businesses in the tourism sector are connected. This data is then used to visualize industry health and power a smart itinerary recommender that prioritizes the sustainable development of the entire regional network.
Contextualizing the Smart Tourism Ecosystem
While most "smart" travel apps act as digital brochures, the academic community is shifting toward the Smart Tourism Ecosystem (STE). An STE is not just about the traveler; it involves a complex interplay between producers, suppliers, and Destination Marketing Organizations (DMOs). The authors identify a critical gap: current systems facilitate the flow of information but ignore the reciprocity between businesses.
The insight here is profound: if we can quantify the "social strength" between a local organic restaurant and a nearby green hotel, we can engineer a recommendation system that doesn't just satisfy the user but strengthens the local economy.
Methodology: From Social Clicks to Industrial Strength
The core of the "Living Green" system relies on two theoretical pillars:
- Strength of Ties Theory (Granovetter): Distinguishing between "strong ties" (close collaborators) and "weak ties" (casual acquaintances) to understand network stability.
- SNS Social Computing (Gilbert): A mathematical model to quantify these ties.
The Engineering of a Social Index
The researchers developed an automated gathering mechanism that scrapes Facebook fan page data, including industry category, geographic location, event frequency, and user interaction patterns. This data is pumped into the following formula to calculate the Social Connection Intensity ():
This formula considers intimacy, duration, and reciprocal services to compute a score that represents the "health" of an industrial node.

Core Innovation: The "Living Green" Implementation
The system manifests in three primary functions: Create, Maintain, and Enhance.
1. Visualizing Industrial Vitality
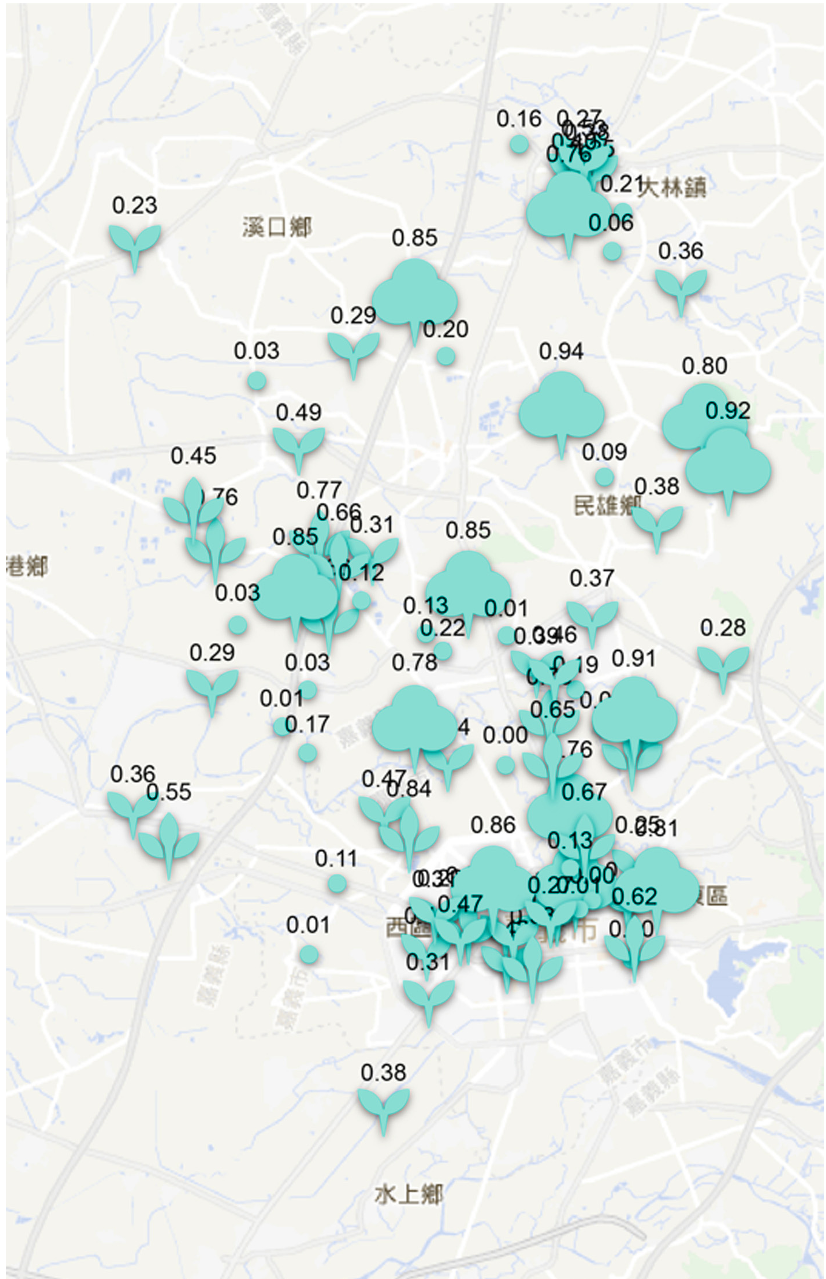
The "Create" function generates a visual map where business activity is represented by sapling icons. The more active the business (based on social computing), the more "grown" the sapling appears. This provides DMOs with a "bird's-eye view" of which business segments are thriving and which need governmental support.
2. Identifying Mutually Beneficial Groups
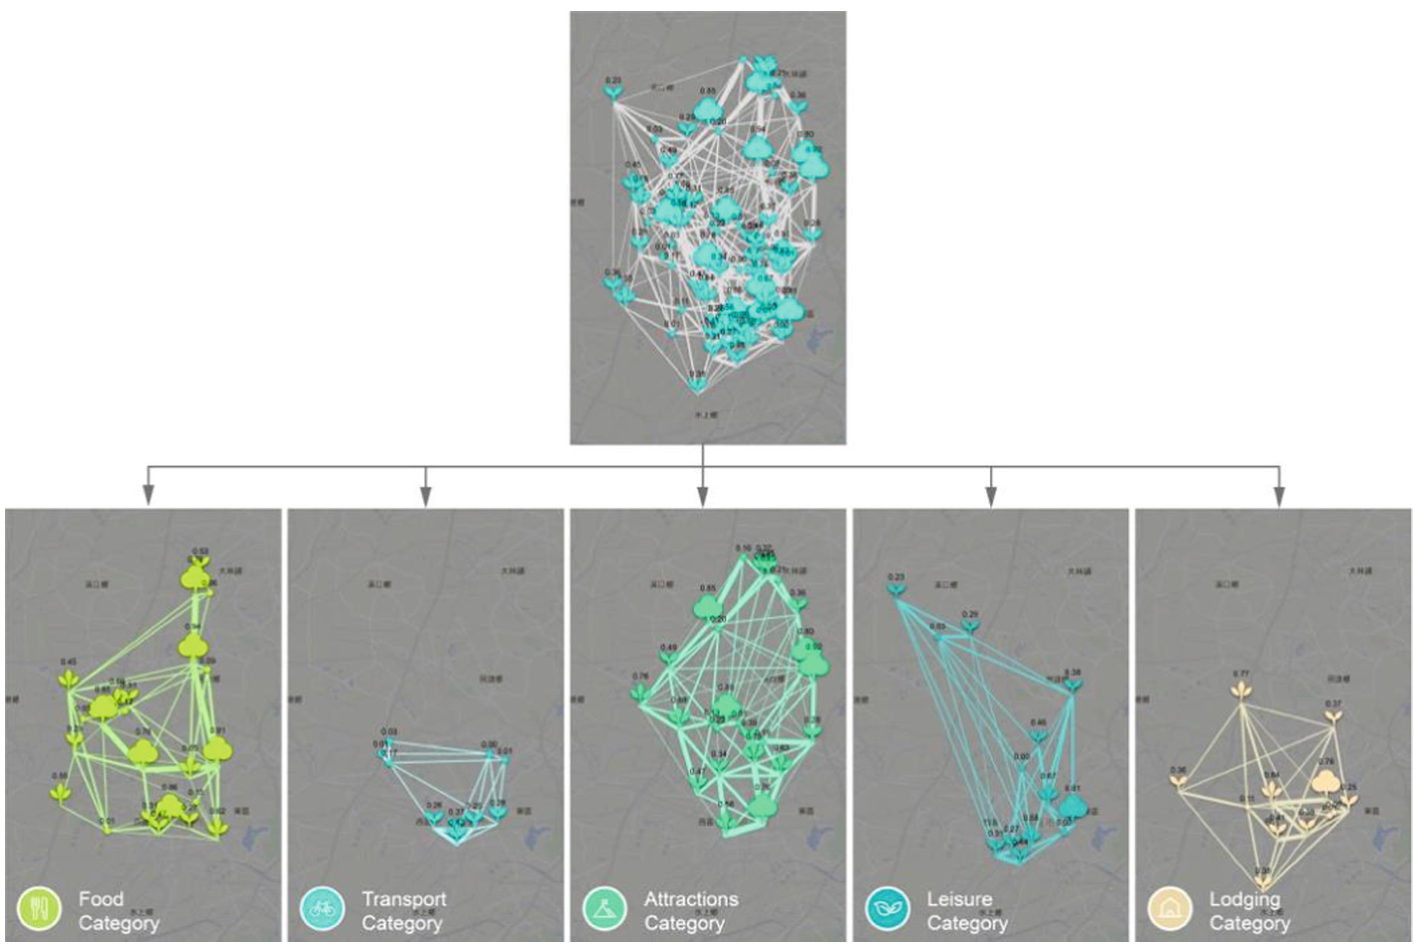
By analyzing "line thickness" (connection intensity), the system groups businesses into five categories: Green Food, Transport, Attractions, Lodging, and Leisure. This creates a resource-sharing cooperation model, effectively turning individual businesses into a unified "surface" of service.
3. The Smart Itinerary Scheduler
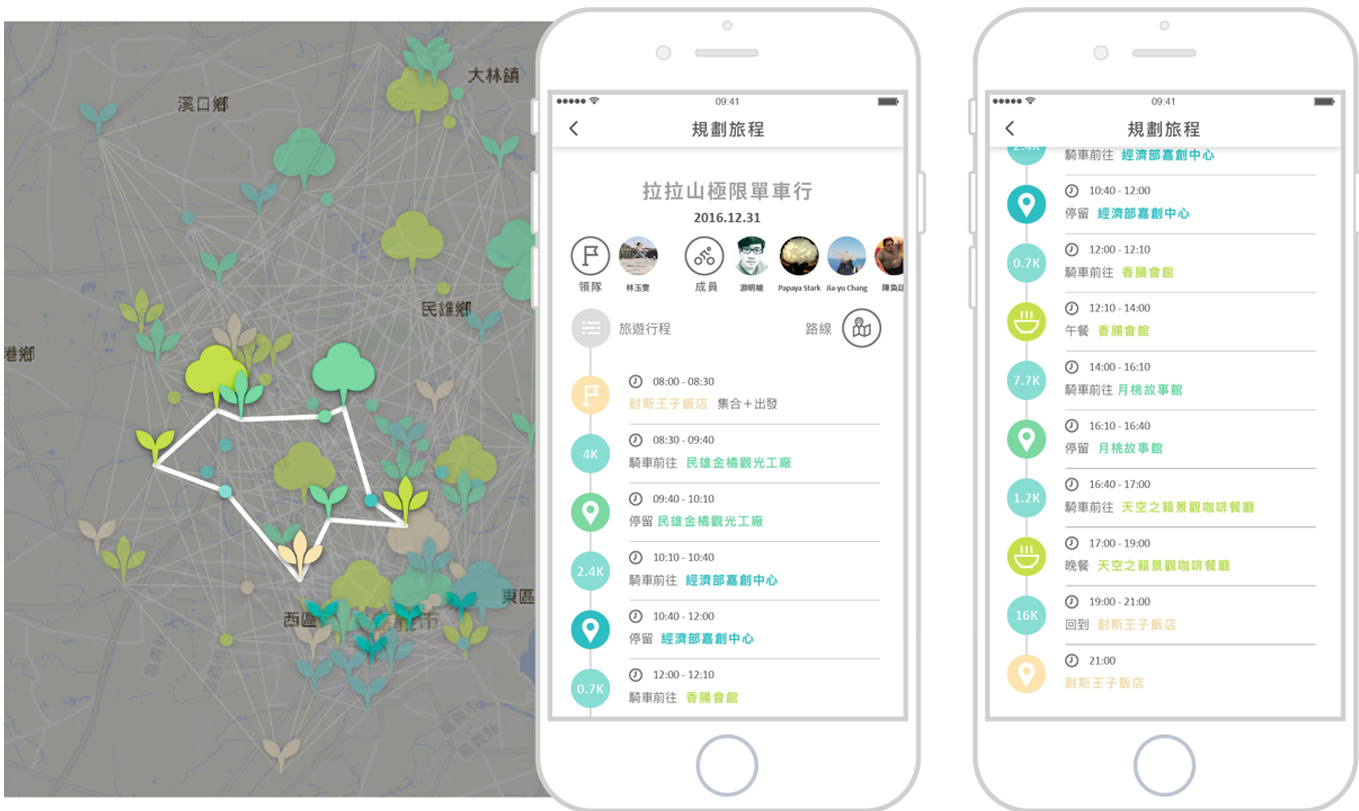
Finally, the user-facing mobile app uses these connection intensities as a weight for its recommendation engine. Instead of just suggesting the "most popular" spot, it suggests itineraries that are logically and industrially linked, providing a more coherent travel experience.
Critical Insight & Future Outlook
The "Living Green" approach is a significant step toward algorithmic regional development. By using social media metadata to map "industrial social maps," the paper demonstrates how to move toward a more resilient tourism sector.
Limitations: The study is heavily dependent on Facebook API availability and user activity data. In regions where Facebook isn't dominant or for businesses with poor digital literacy, the "Social Index" might be skewed, potentially marginalizing businesses that are physically successful but digitally inactive.
Future Work: The integration of sentiment analysis (text mining of comments) would be a logical next step to refine the "Social Connection Intensity," moving from quantitative counts to qualitative relationship assessment.