
Decoding the Mobile Persona: A Deep Dive into Data, Mobility, and Application Usage
EMERGING TOPICS IN COMPUTING
This paper presents a comprehensive empirical study of mobile Internet user behavior based on HTTP traffic data from 2G/3G networks in a major Chinese city. It introduces a multi-dimensional analysis framework covering data usage, mobility patterns (via cell tower tracking), and application usage, using Divisive Hierarchical Clustering to identify distinct "interest clusters."
TL;DR
This study provides a rare, large-scale look at the "digital DNA" of mobile users by analyzing a week of HTTP traffic from 4.5 million subscribers. It identifies a critical segment of "Big Consumers"—users who simultaneously consume the most data and move across the most cell towers—and explores how social media, search, and e-commerce uniquely shape our network footprint.
Context: The Growing Challenge of Capacity Planning
As mobile data traffic continues its exponential climb, ISPs face a daunting task. It isn't just about the amount of data; it's about where and how it's consumed. This paper argues that to truly manage a network, we must understand the correlation between three dimensions: how much we download (Data Usage), how far we travel (Mobility), and what we actually do (Application Usage).
The "Big Consumer" Paradox
One of the most striking revelations of the study is the extreme inequality in data consumption.
1. The 1% Rule
The authors found that 80% of users contribute a measly 0.21% of total traffic. Conversely, the top 1% ("Heavy Users") are responsible for a staggering 88% of all data. These individuals aren't just downloading more in one sitting; they are active for 14+ hours a day and use the network nearly every day of the week.
2. Mobility as a Resource Multiplier
Mobility isn't just about moving; in a cellular network, it triggers "hand-offs" between base stations, consuming radio signaling resources. The study classifies users by the number of distinct cells () they access:
- Non-mobility:
- Low mobility: 1 < U_c \leq 10
- High mobility: U_c > 50
Crucially, Heavy Users are rarely stationary. 76.5% of heavy users exhibit normal to high mobility, compared to a much lower percentage in the general population.
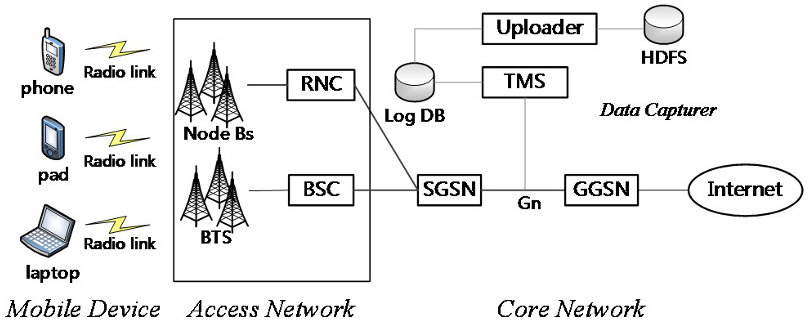 Figure 1: The architecture of the 2G/3G core network where data was collected at the Gn interface.
Interest Clusters: Why We Browse
Using Divisive Hierarchical Clustering and Normalized Entropy, the researchers mapped user fingerprints. Entropy measures the "diversity" of interest:
- Low Entropy: The user is "stuck" on one thing (e.g., constant Social Networking).
- High Entropy: The user is browsing across many categories (News, Search, Mail).
Key Application Insights:
- Social Networking: The undisputed king, accounting for over 55% of traffic.
- E-commerce: Shows the highest "stickiness" or engagement, with users spending the most time per session.
- Video & News: Interestingly, these have high entropy, meaning users tend to browse them intermittently rather than staying locked in, likely due to data costs or the nature of content consumption.
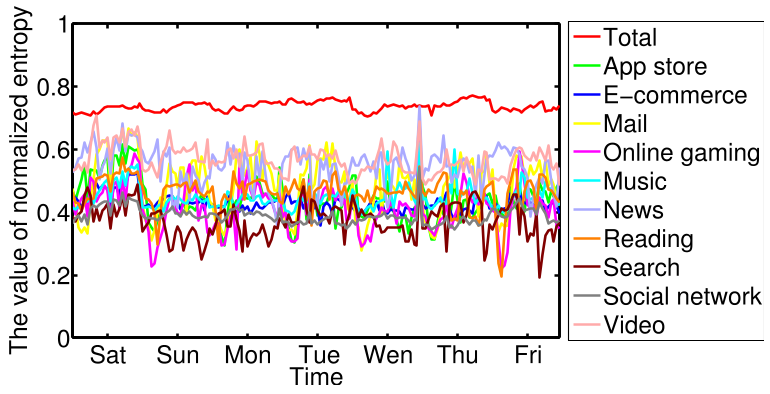 Figure 2: Normalized entropy values across different interest clusters over time.
Synthesis: The Interplay of Behaviors
The methodology proves that your physical location impacts your digital life. As mobility increases, the diversity of applications accessed also increases. High-mobility users (commuters, travelers) visit an average of 10 different application categories per week, whereas stationary users visit only 3.
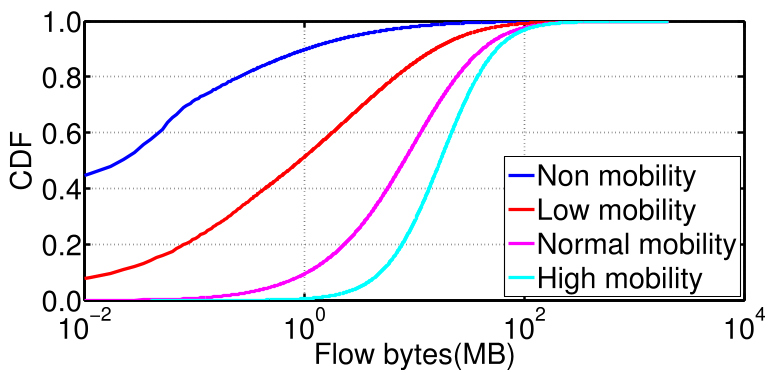 Figure 3: CDF of traffic generation across different mobility groups, showing that higher mobility correlates with higher data volume.
Critical Perspective & Future Outlook
While this paper provides a robust baseline for 3G-era behavior, the leap to 5G and 6G introduces new variables:
- Video Dominance: In 2014, video was limited by bandwidth. Today, it is the primary traffic driver, likely lowering the entropy of the "Video Cluster."
- App vs. Web: The study relies on HTTP headers. With modern HTTPS/TLS encryption and the shift to native apps, identifying categories now requires sophisticated ML-based traffic fingerprinting.
Takeaway for Engineers: Network management shouldn't just be about "fat pipes." It requires application-aware scheduling. Since "Big Consumers" drain both data and signaling (radio) resources simultaneously, specific policies for high-mobility social media usage during peak hours could significantly reduce congestion.