
Mapping the Heart of a Crisis: Emotion Analysis During the California Camp Fire
Emotion Analysis of Twitter Users on Natural Disasters
This paper presents a supervised machine learning framework for emotion analysis of Twitter users during the 2018 California Camp Fire. Utilizing a Support Vector Machine (SVM) classifier and TF-IDF features, the system monitors emotional fluctuations across six categories and integrates geographic visualization for real-time situational awareness, achieving an overall classification accuracy of 82.54%.
TL;DR
This paper introduces a supervised learning framework to analyze the emotional pulse of Twitter users during the devastating 2018 California Camp Fire. By shifting the focus from simple sentiment (positive/negative) to specific emotional states—Fear, Sadness, Anger, Disgust, Surprise, and Calm—and layering this data onto geographic maps, the researchers provide a blueprint for how social media can guide mental health first responders during large-scale natural disasters.
Background & Motivation
In the wake of climate change, natural disasters are increasing in frequency and intensity. Traditional public surveys for disaster impact assessment are slow and retrospective. Twitter, however, offers a high-velocity data stream that captures the immediate psychological state of a population.
The authors identified a gap in existing literature: while many systems focus on what is happening (situational awareness), few focus on how survivors feel (emotional awareness). Understanding whether a community is dominated by "Fear" (requiring immediate reassurance) or "Sadness" (requiring long-term mental health support) is crucial for effective resource allocation.
Methodology: From Raw Tweets to Emotional Insights
The system follows a rigorous four-stage pipeline: Data Collection, Preprocessing, Classification, and Visualization.
- Context-Aware Emotion Model: Instead of using the standard Ekman's "Happiness" category, which is jarring in a disaster context, the authors intelligently substituted it with "Calm".
- Machine Learning Backend: The system employs a Support Vector Machine (SVM) paired with TF-IDF (Term Frequency–Inverse Document Frequency) features. This combination remains a robust baseline for short-text classification due to its high efficiency and accuracy in high-dimensional spaces.
- The Preprocessing Edge: Twitter data is notoriously "noisy." The authors applied spelling correction and lemmatization to ensure that emotional keywords were not lost to typos or slang.
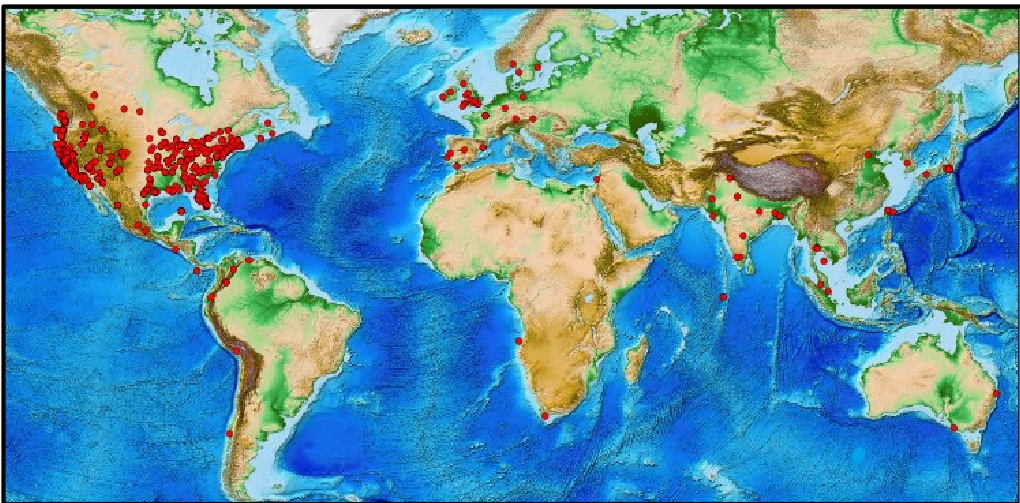 Figure 1: Geographic distribution of tweets related to the Camp Fire, concentrated primarily in the United States.
Experimental Results: The Lifecycle of Disaster Emotion
The model was tested on 588,674 tweets collected between November 11–20, 2018.
Key Findings:
- The "Fear" Peak: Fear was the dominant emotion at the onset of the fire but saw a "dramatic fall" as the situation stabilized.
- Persistent Sadness: Sadness emerged as the most significant and consistent emotion throughout the disaster duration.
- Accuracy: The SVM classifier achieved an 82.54% accuracy, though it struggled with "Anger" due to external noise (e.g., political discourse surrounding the disaster).
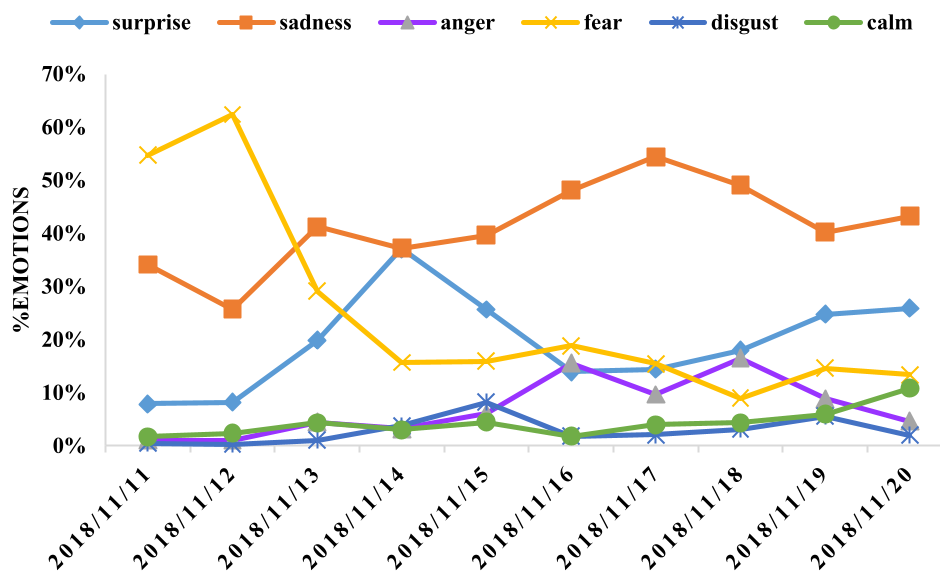 Figure 2: Percentage of emotions analyzed over the 10-day period. Note the dominance of Sadness and the volatility of Fear.
The "Trump" Effect in NLP
Interestingly, the authors noted a low recall for "Anger." This was attributed to a specific event: President Trump mistakenly referred to the city of "Paradise" as "Pleasure." The resulting backlash in the Twitter corpus skewed the feature weights for the word "Trump," leading the classifier to miscategorize political anger against the disaster's emotional reality.
Critical Analysis & Future Outlook
The strength of this work lies in its temporal-geographic coupling. By knowing where the sadness is most concentrated, authorities can deploy grief counselors to specific states or cities.
Limitations:
- Geographic Bias: Currently, only tweets with enabled geographic tags are mapped, which represents a small fraction of total users.
- Linguistic Limits: The study is confined to English, though disasters are global.
The Path Forward: Integrating this system with pre-trained transformers (like BERT) could further improve accuracy by understanding context-heavy sarcasm or political nuances. This study serves as a vital first move toward a "geographic vision" for disaster feedback systems, turning social media noise into actionable psychological intelligence.