
Decoding the Internal Landscape: Why SVM Rules Peripheral Physiology in Emotion AI
Emotion classification based on physiological signals induced by negative emotions: Discriminantion of negative emotions by machine learning algorithm
This study investigates the classification of four specific negative emotions—sadness, fear, surprise, and stress—using multi-channel physiological signals (EDA, ECG, SKT, and PPG). After extracting 28 distinct features, the researchers compared five machine learning models, discovering that Support Vector Machines (SVM) achieved a perfect 100.0% classification accuracy.
TL;DR
Human emotions are often masked by social expectations, but our biology rarely lies. This paper presents a rigorous comparison of machine learning algorithms—LDA, CART, SOM, Naïve Bayes, and SVM—to classify negative emotions (sadness, fear, surprise, and stress) using internal physiological signals. The verdict? Support Vector Machines (SVM) achieved a flawless 100% accuracy, proving that non-linear architectures are the key to unlocking the body's hidden emotional language.
The Problem: The Mask of Expression
Most Human-Computer Interaction (HCI) systems rely on external cues like facial expressions or voice modulation. However, these are subject to "social masking"—the conscious effort to hide one's true feelings. Physiological signals (heart rate, skin temperature, and sweat gland activity) are regulated by the Autonomic Nervous System (ANS) and are far harder to manipulate.
The challenge lies in the overlap. Sadness and fear can look remarkably similar in terms of raw heart rate metrics. Previous models often failed because they assumed linear relationships that simply don't exist in the complex feedback loops of human biology.
Methodology: Inducing and Measuring "True" Emotion
The researchers didn't just ask people how they felt; they induced it. Using 40 meticulously validated audio-visual clips (from movies and documentaries), they triggered specific negative states in 12 participants.
The Sensor Suite:
- EDA (Electrodermal Activity): Measuring "skin sweat," a direct window into sympathetic nervous system arousal.
- ECG & PPG (Electro/Photoplethysmography): Capturing Heart Rate Variability (HRV) and blood volume changes.
- SKT (Skin Temperature): Tracking localized blood flow changes caused by vascular resistance.
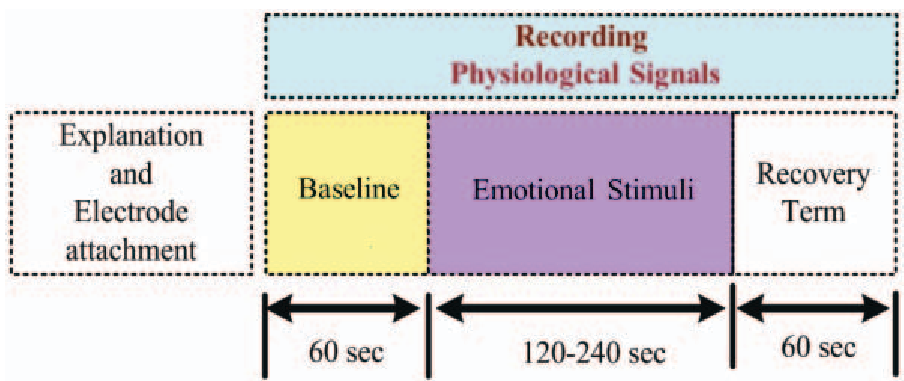 Figure 1: The synchronized process of stimulus presentation and signal acquisition.
The Core Insight: Why SVM Won
The study extracted 28 features ranging from mean GSR (Galvanic Skin Response) to high-frequency heart rate components (FFTap_HF). When these features were fed into different models, the results were polarizing:
- LDA (50.7%): Failed. The linear assumption was too rigid for the high variance of physiological data.
- SOM (51.2%): As an unsupervised map, it struggled to find clear cluster boundaries for these specific labels.
- SVM (100.0%): Succeeded perfectly.
The "Physics" of SVM's Success
Physiological responses for emotions like "Stress" and "Fear" often reside in a high-dimensional space where classes are not linearly separable. SVM, particularly with a Gaussian Radial Basis Function (RBF) kernel, projects this data into an even higher-dimensional space where an "optimal hyperplane" can perfectly bisect the different emotional states. It essentially finds the "sweet spot" that accounts for both the intensity of the signals and their specific timing.
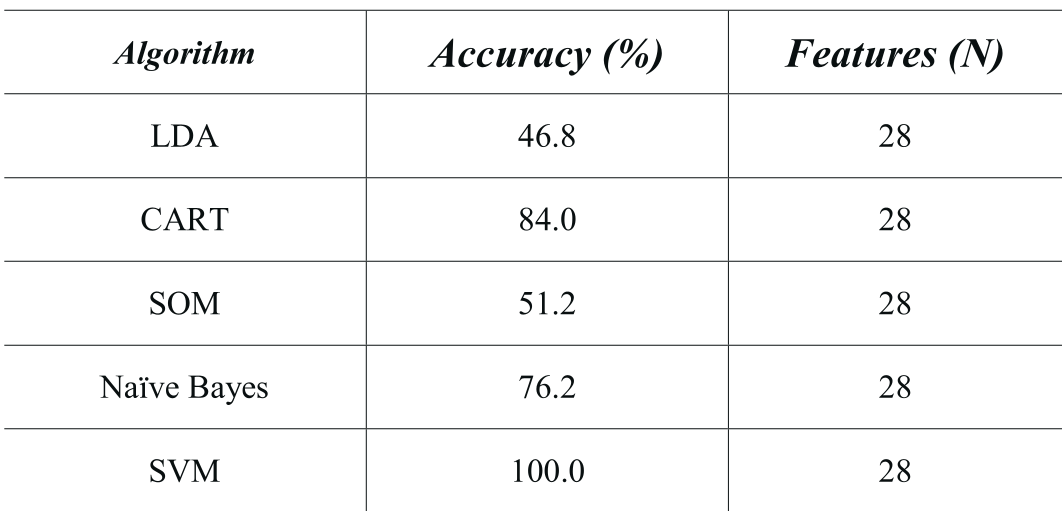 Table 1: The dominance of SVM across 28 extracted features.
Depth and Results
The classification breakdown revealed that while Sadness was relatively easy for CART (93.3%), Surprise was a major stumbling block for most algorithms (LDA only hit 42.7%). Surprise is a "transient" emotion, making its physiological signature brief and easily confused with the onset of fear or stress. SVM’s ability to maximize the margin between these support vectors allowed it to maintain perfect precision even where others saw noise.
Critical Analysis & Conclusion
While 100% accuracy in a laboratory setting is a monumental achievement, the small sample size (12 participants) remains a caveat. Physiological responses are deeply individual; what looks like "stress" for one person might look like "fear" for another.
Takeaway: This research validates that with enough high-quality features (28) and a robust non-linear classifier (SVM), computers can accurately distinguish between subtle negative states. This paves the way for "Emotional Intelligence" in AI—systems that know you’re stressed before you’ve even admitted it to yourself.
Future Outlook: The next frontier is Standardization. As the authors note, we need a universal model for physiological emotional patterns to move these systems out of the lab and into the real world—integrated into our cars, our workplaces, and our healthcare.