
Decoding Our Neural Cinema: High-Accuracy Emotion Recognition via Movie-Induced EEG
9066_Emotion recognition based on EEG changes in movie viewing.
This paper presents a movie-elicited EEG emotion recognition study capable of classifying five distinct emotional states (neutral, happy, sad, tense, and disgust). By utilizing Autoregressive (AR) model-based Power Spectral Density (PSD) and Fisher Discriminant Ratio (FDR) for feature selection, the authors achieved a Peak SOTA-level accuracy of 93.31% using a Support Vector Machine (SVM).
TL;DR
Can a machine truly know if you are sad, disgusted, or just tense while watching a movie? This study demonstrates that by analyzing the "spectral signature" of our brains, particularly in high-frequency bands like Beta and Gamma, we can classify five complex emotional states with a remarkable 93.31% accuracy. By combining movie-clip elicitation with Fisher Discriminant Ratio (FDR) analysis, the research provides a roadmap for more intuitive Human-Computer Interaction (HCI).
The Challenge: Finding the Signal in the Neural Noise
Emotion recognition is the "Holy Grail" of modern HCI. While facial expressions and voice can be masked or faked, Electroencephalogram (EEG) signals provide a direct window into the central nervous system. However, the brain is a noisy place. Existing studies often fail to pinpoint exactly which electrodes and which frequencies are the smoking guns for specific emotions.
The authors argue that many previous models are too simplistic—focusing only on "Arousal" or "Valence"—whereas real human experience involves discrete, identifiable states like "Tense" or "Disgust."
Methodology: The Spectral Hunt
The researchers used 15 carefully curated movie clips to evoke five states: Neutral, Happy, Sad, Tense, and Disgust.
1. Feature Extraction: Beyond Simple FFT
Instead of standard Fourier Transforms, they used an Autoregressive (AR) model (Burg algorithm) to compute Power Spectral Density (PSD). The AR model provides better resolution for short data segments, allowing for more precise tracking of emotional shifts.
2. Identifying Discriminative Features (FDR)
Not all brain regions are created equal. The researchers used the Fisher Discriminant Ratio (FDR) to map out which electrodes actually contributed to separating the five emotional classes.
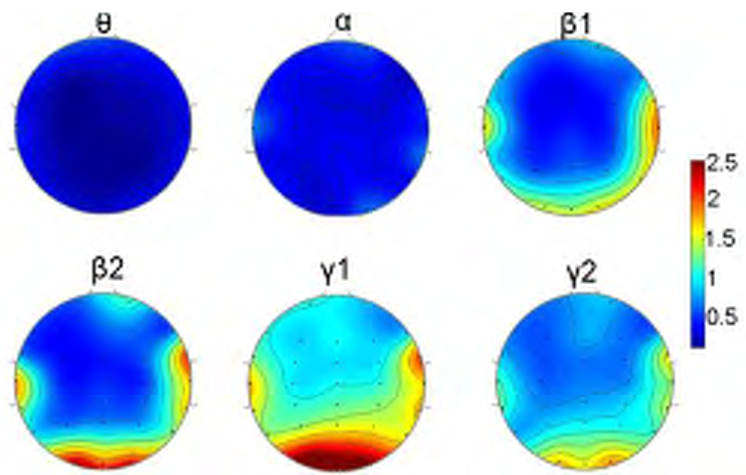 Figure 1: FDR Topography showing that high-frequency bands (Beta and Gamma) in the occipital and temporal regions are the most discriminative.
Key Insights and Results
The findings yielded a few "Aha!" moments for the neuroscientific community:
- The High-Frequency Dominance: While many researchers focus on Alpha waves, this study proved that Beta and Gamma bands (13–44 Hz) are the real MVPs for discriminating between complex emotions.
- The Sadness Symmetry: Interestingly, "Sad" was the only condition that showed significant frontal asymmetry across all frequency bands, providing a potential biomarker for depressive or negative states.
- SVM Performance: The Support Vector Machine (using a Gaussian RBF kernel) significantly outperformed the Asymmetry Index (AI) approach.
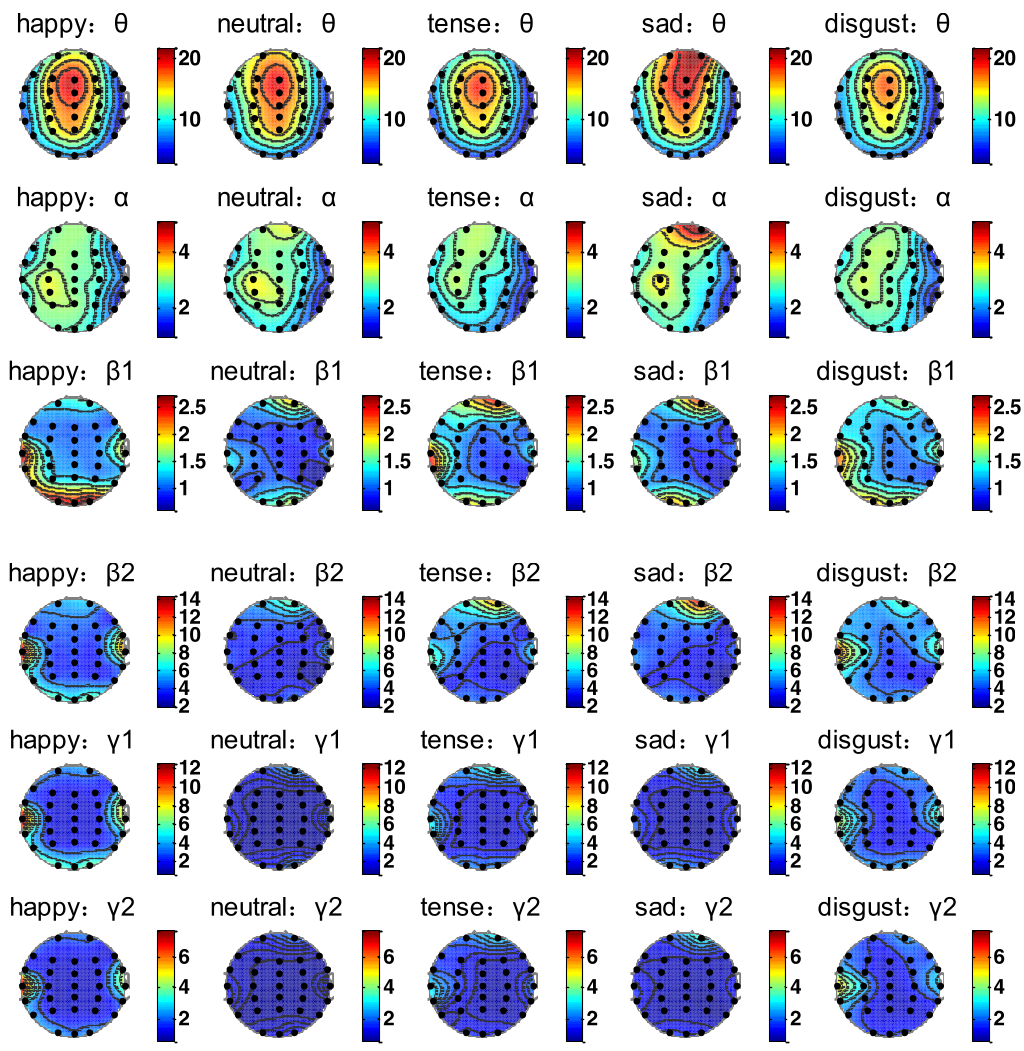 Figure 2: PSD-based classification consistently reached over 90% accuracy, proving its superiority over simple asymmetry indexes.
Critical Analysis & Conclusion
This work stands out for its high accuracy in a 5-class problem, which is significantly more difficult than the standard binary classification (Positive vs. Negative).
Limitations & Future Work
Despite the high accuracy, two major hurdles remain:
- The "Day-Effect": A person's EEG baseline changes based on diet, sleep, and mood. A model trained today might struggle tomorrow.
- Discrete vs. Dimensional: While the 5-class model works well here, the authors acknowledge that human emotion is often a "blend" rather than a bucket.
Takeaway
For developers of AI systems—whether in healthcare, gaming, or automotive safety—this research proves that Beta and Gamma frequency features in the temporal and occipital lobes are the most reliable indicators of a user's true emotional state. The 93.31% accuracy rate suggests that we are closer than ever to machines that truly "feel" what we feel.