
emotionVis: Beyond Polarity — Mapping the Emotional Landscape of Social Networks
emotionVis: Designing an Emotion Text Inference Tool for Visual Analytics
This paper introduces emotionVis, an advanced visual analytics tool designed for inferring multi-dimensional emotions from social media text. Built on a massive dataset of 1.6 million user-tagged Facebook posts, it enables the detection of 143 discrete emotion types, grouped into 6 core categories, while simultaneously tracking valence and arousal.
TL;DR
Standard sentiment analysis—the simple "thumbs up or down"—is no longer enough for modern brands. emotionVis is a professional-grade visual analytics prototype that uses a massive training set of 1.6 million user-tagged Facebook posts to detect 143 discrete emotion types. It moves beyond simple polarity to measure Arousal (intensity) and Valence (pleasure), providing practitioners with a granular "feelings meter" for real-time social media monitoring.
The "Polarity" Problem: Why Sentiment is Not Emotion
Most commercial tools today offer a sentiment score. While knowing if a conversation is "negative" is useful, it is dangerously incomplete. For a marketing manager, the "anger" of a customer facing a product failure is a different strategic signal than the "disgust" of a trolling behavior.
The authors argue that existing research has two major flaws:
- Dependency on Offline Models: Researchers often use Ekman’s 6 basic emotions (Joy, Sadness, Anger, Fear, Surprise, Disgust), which were developed for facial recognition, not the high-energy, performative landscape of social media.
- Lexicon Limitations: Traditional emotion lexicons (like ANEW) lack the specific slang and "internet-speak" that defines modern digital interaction.
Methodology: Turning 12 Million Posts into a "Feelings Meter"
The secret sauce of emotionVis is its training data. Instead of hiring external annotators (which is slow and subjective), the team collected 12 million public Facebook posts. They focused on the 1.6 million posts where users utilized Facebook's "feeling tag"—a feature where users explicitly state "feeling excited" or "feeling frustrated."
The Classifier Architecture
The system employs four distinct supervised ML classifiers:
- Discrete Classifier: Maps text to 28 high-volume specific feelings.
- Core Classifier: Groups feelings into 6 clusters: Joy, Sadness, Anger, Fear, Excitement, and Empowerment. (Note the addition of positive, high-arousal categories specific to social media).
- Valence & Arousal Classifiers: Quantifies the "positivity" and "energy" of the text.
 The workflow from raw data collection to the multi-layered classification engine.
Visualizing Social "Stickiness"
The front-end of emotionVis isn't just a collection of charts; it's designed around Action Design Research (ADR)—built in collaboration with a social media agency.
One of its most compelling features is the ability to track "Emotional Stickiness." This refers to how specific feelings become attached to certain people or topics over time. For example, during a PR crisis, negative emotions can get "stuck" to a specific executive. The tool uses term frequencies within specific emotion categories to reveal these shifting attachments.
Key Visualization Components:
- The Emotional Footprint: A 2D scatterplot (Arousal vs. Valence) showing where a brand's posts sit compared to the audience's reaction.
- Sunburst Diagrams: Decomposing core emotions (e.g., seeing that "Anger" is actually composed mostly of "Annoyance").
- Time-Series Tracking: Zoomable charts to monitor "Emotional Reverberation"—how a single post can trigger a firestorm of high-arousal negativity.
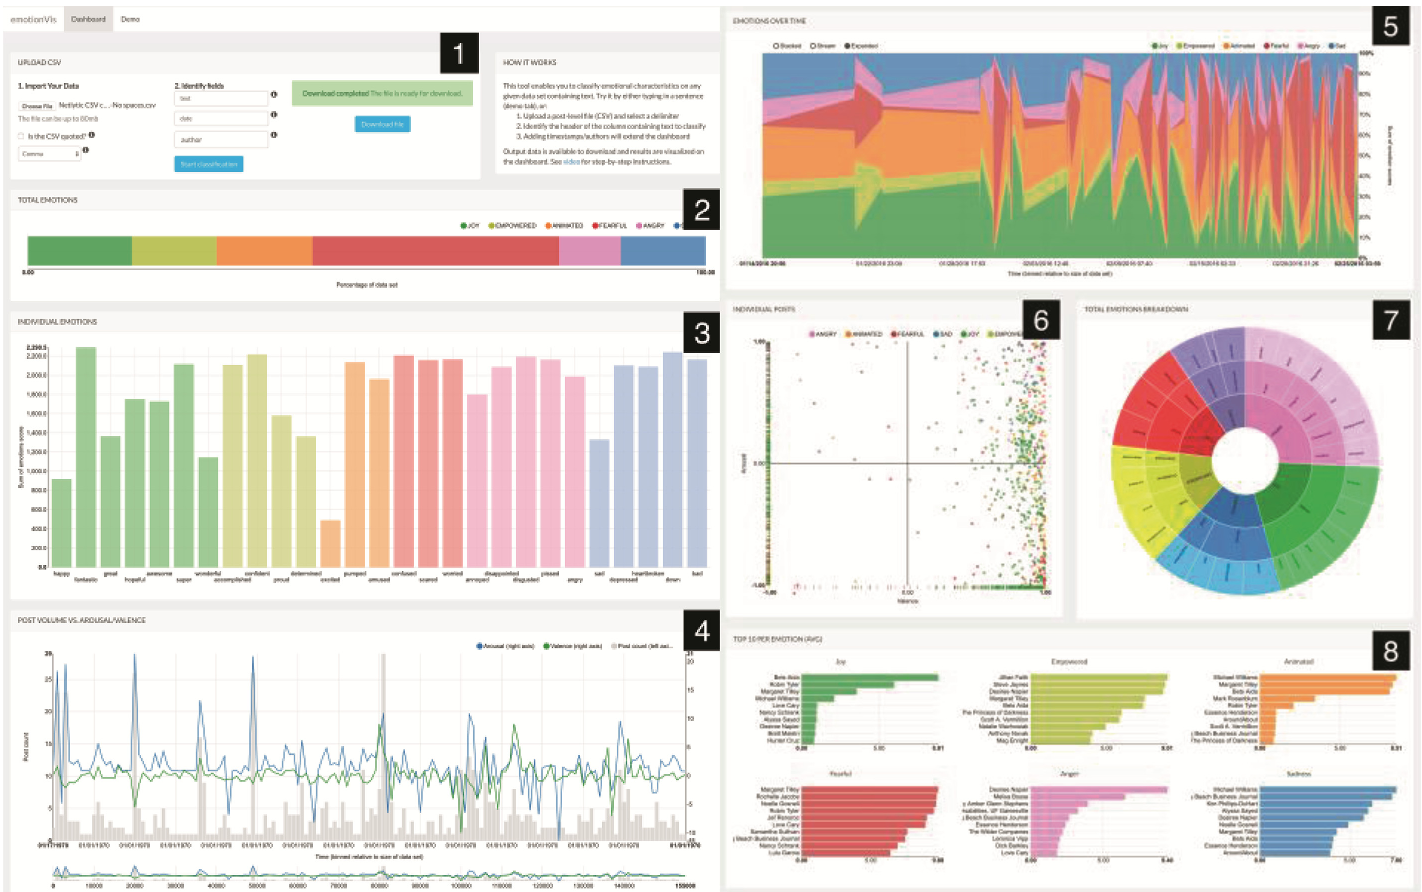 The UI facilitates a thematic progression from high-level distributions to granular post-level analysis.
Real-World Impact and Experiments
The tool was stress-tested by a social media agency on a campaign for Bang & Olufsen. It allowed managers to:
- Compare Alignment: Does our "Excited" promotional post actually generate "Excitement" in the comments?
- Identify Influencers: Ranking users not by follower count, but by the intensity of the specific core emotions they express toward the brand.
Results Summary:
- Data Scale: 1.6 million user-labeled examples provide a significantly more robust "social-first" ground truth than manual labeling.
- Granularity: 143 feeling types detected, far exceeding the standard 6 or 8 categories found in previous literature.
Critical Insight & Conclusion
The true value of emotionVis lies in its recognition that online emotion is skewed. People go to social media for "affective jolts"—this means we see more high-arousal and positive emotions (like empowerment) than in traditional offline psychology.
Limitations: Currently, the tool relies on .csv imports from other commercial trackers. The next logical step, as noted by the authors, is real-time API integration to turn emotionVis into a "live cockpit" for digital crisis management.
Takeaway: If you are still measuring "Sentiment," you are only seeing the color of the ocean. To navigate the storm, you need to measure the "Arousal"—the height of the waves.