
Deciphering the Sonic Pulse: Machine Learning for Regional Emotion Recognition through Music
Are you emotional or depressed? Learning about your emotional state from your music using machine learning
This paper introduces a machine learning-based music perception model designed to identify emotional content in audio streams using audio features. By mapping acoustic signatures to Thayer’s Valence-Arousal (VA) plane via linear regression, the authors analyze the "emotional propensity" of four major US cities using a custom-compiled Radio-Induced Emotion Dataset (RIED).
TL;DR
Can the music played on the radio tell us if a city is depressed or energized? This paper proposes a machine learning framework that maps acoustic features to the Valence-Arousal (VA) plane, enabling the study of "Radio-Induced Emotions." By analyzing broadcasts across four major US cities, the researchers uncovered distinct regional "emotion trajectories" that reflect local culture and daily routines.
Background: Music as a Language of Emotion
Unlike language, music acts as a universal "language of emotion" that resonates directly with our neural tissues. While we often view music as mere entertainment, it serves as a powerful external force that manipulates our internal states. The authors position this work at the intersection of Music Information Retrieval (MIR) and Music Emotion Recognition (MER), aiming to bridge the gap between raw audio signals and complex human psychology.
The Problem: The Subjectivity Trap
MER faces two primary hurdles:
- Categorical Ambiguity: Words like "happy" or "mellow" are subjective.
- Context Gap: Traditional MER focuses on labeling songs in isolation, ignoring how music reflects the collective mood of a geographic region or a specific time of day.
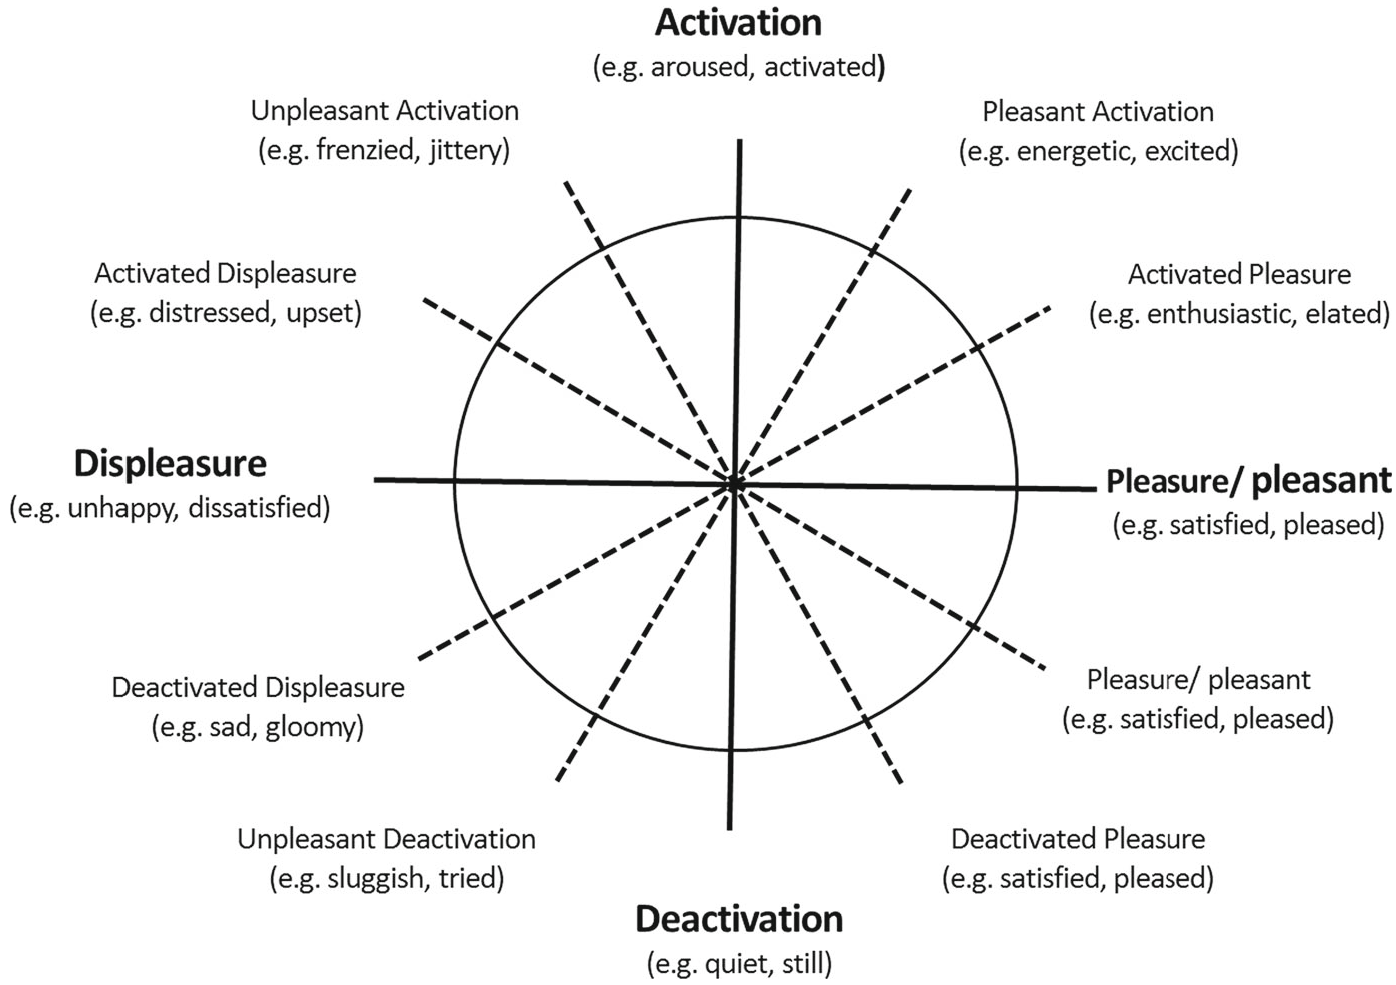
The authors solve the first problem by adopting Thayer’s Dimensional Model, which quantifies emotion on a 2D plane: Valence (how positive/negative) and Arousal (intensity).
Methodology: Mapping Sound to Feeling
The authors developed a two-stage perception model:
1. Feature Engineering (Encoding)
Instead of relying on lyrics, which are language-dependent, the model extracts 54 acoustic features categorized into:
- Rhythmic Features: Beat histograms and tempo.
- Spectral Features: Spectral centroid, roll-off, and flux.
- Timbre Features: Mel-Frequency Cepstral Coefficients (MFCC) and Chroma.
2. The Model
A Linear Regression (LR) model was trained using the DEAM (Dataset of Emotional Analysis of Music). The objective was to minimize the Mean Square Error (MSE) between predicted VA values and ground truth annotations.
Experiments: Measuring the "Vibe" of a City
The researchers compiled the Radio-Induced Emotion Dataset (RIED) by monitoring radio stations in NYC, LA, Houston, and Miami for one month.
Data Insights: The Power of Repetition
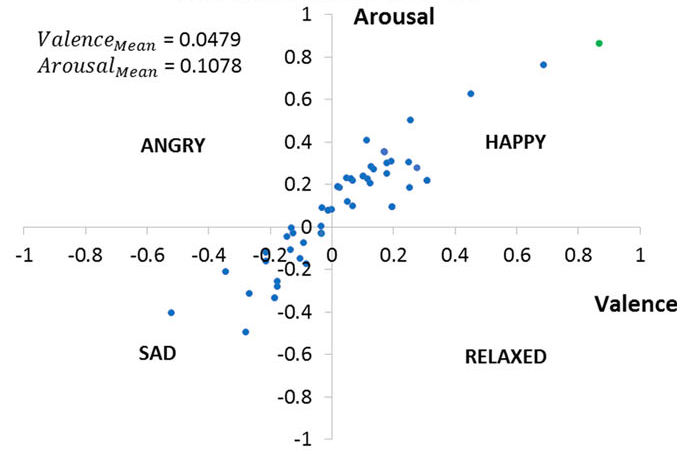
The study found that a small number of "hit" songs are highly repetitive. Interestingly, the repetition of specific tracks like Camila Cabello’s "Havana" significantly influences the "aggregate emotion" of a region.
Findings: Regional Emotion Trajectories
- Steady Mornings: Emotions are generally steady and lower in intensity between 8:40 AM and 9:20 AM (rush hour).
- Consistent Happiness: Miami and Los Angeles showed a consistent "pleasant activation," reflecting a stable, "happy" city culture.
- Frenzied Centers: Houston and New York experienced more "frenzied" and "jittery" mood swings during the mid-day and afternoon periods.
Critical Analysis: Limitations and Future Directions
While the study provides a fascinating "window" into musical culture, it acknowledges a major bottleneck: Dataset Imbalance. The DEAM dataset is heavily clustered between VA indexes 3 and 7, meaning extreme emotions (intense depression or pure mania) are underrepresented, limiting the model's predictive range.
Future Work includes:
- Integrating Twitter (X) data for multi-modal perception.
- Applying these insights to Neuromarketing, such as tailoring in-store music to drive specific purchasing behaviors.
- Moving from Linear Regression to Support Vector Machines (SVM) or Deep CRNNs to capture non-linear emotional nuances.
Conclusion
This paper shifts MER from a technical classification task to a sociological tool. By treating radio waves as a mirror of a city's soul, it opens new paths for targeted marketing, mental health monitoring, and cultural research.