
The Power of Negative Talk: Mapping the Hidden Network of Global Brands
Empirical analysis of implicit brand networks on social media
This paper presents a large-scale empirical analysis of implicit brand-brand networks on Facebook. By leveraging a MapReduce-based framework on 2TB of social data, the authors construct a weighted, undirected network where links represent overlapping user interests and interactions (comments and likes) across different brand pages.
Executive Summary
In the digital age, a brand is no longer just what a company says it is; it is the sum of every user interaction across the social web. This research provides a deep dive into the Implicit Brand Networks of Facebook, analyzing 13,806 brands and 280 million users. Using a MapReduce-based framework, the authors prove that influence in the social sphere is deeply tied to brand size, but surprisingly, influential brands often attract more negative than positive engagement. This work transitions brand analysis from simple metrics to complex graph theory.
Problem & Motivation: Beyond the "Follow" Button
Most marketing analytics rely on explicit signals—who follows whom. However, the truly valuable data lies in implicit connections: if a user likes both Starbucks and Victoria's Secret, an invisible bridge is formed between these entities.
The challenge? Processing this "Big Data" at scale (2 TB) and normalizing it so that massive brands don't drown out smaller, high-affinity communities. The authors set out to answer whether brand size equals influence and how the "vibe" (sentiment) of a brand's community affects its standing in the global network.
Methodology: High-Performance Network Science
The core of the methodology lies in the construction of a Weighted, Undirected Brand-Brand Network.
- Normalization: To ensure fair comparison, the weight between two brands is normalized by the product of their fan counts. This prevents two "giants" from appearing related simply because they have millions of random overlapping followers.
- Distributed Computing: Calculating intersections for millions of users across thousands of brands is computationally expensive. The authors utilized a MapReduce workflow to generate the adjacency matrix.
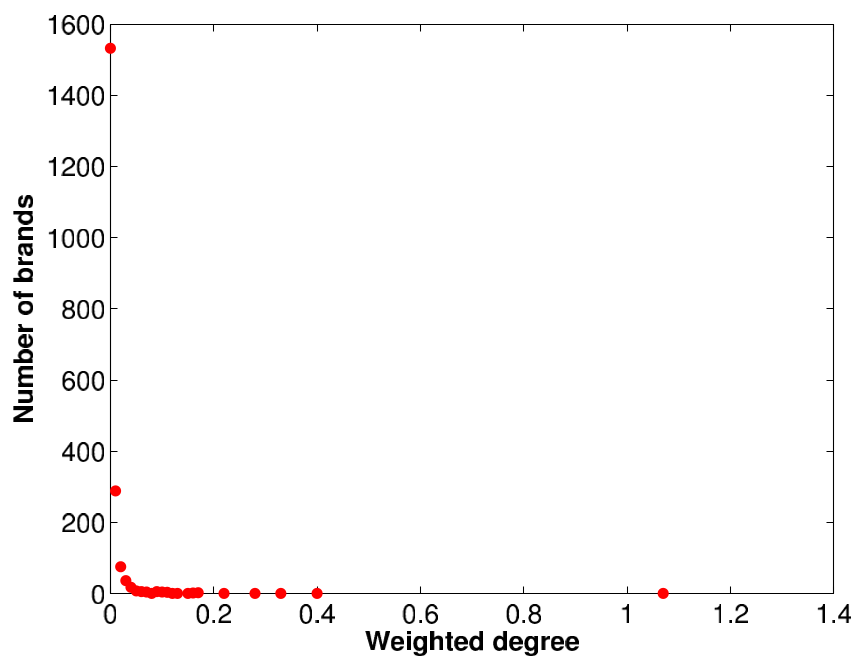 Figure: The Degree Distribution showing the connection strength across the weighted brand network.
The "Negativity" Insight: Experimental Results
The study identifies the Top 10 most influential brands using Eigenvector Centrality. While Barack Obama and Starbucks unsurprisingly lead the pack, the correlation analysis yields a counter-intuitive breakthrough.
- Size vs. Influence: There is a strong positive correlation (0.676). Big brands generally have higher network influence.
- Sentiment vs. Influence: There is a negative correlation (-0.282).
This suggests that influence acts as a double-edged sword. The more influential a brand becomes, the more it becomes a target for criticism. Critically, the data indicates that negative comments have a "powerful ability to generate awareness," essentially feeding the brand's presence in the network faster than polite, positive praise.
 Table: Correlation between Centrality (EC), Size, and Sentiment (Sent).
Critical Insight & Conclusion
The "Small World" of brands is surprisingly dense, with an average path length of only 1.5. This means a shift in sentiment or a viral event on one brand page can ripple through the entire consumer ecosystem almost instantly.
The Takeaway for Brand Managers: Don't fear the "hater." While negative sentiment is often viewed as a failure, in the context of network theory, it is a signal of high influence and high engagement. The most dangerous state for a brand isn't being "disliked"—it's being "unconnected."
Limitations: The study focuses primarily on English-speaking content and Facebook's 2014 landscape. In the modern era of TikTok's algorithmic feed (rather than user-driven "likes"), these implicit networks may be even more volatile. Future research should apply these graph-based metrics to cross-platform "Social Graphs" to see if the negativity-influence correlation holds true in short-form video ecosystems.