
Foursquare Dynamics: Cracking the Code of Urban Social Sensing
Empirical Observation of User Activities: Check-ins, Venue Photos and Tips in Foursquare
This paper presents a large-scale empirical study on Foursquare user activities, specifically analyzing the correlations between check-ins, venue photos, and tips. By utilizing a dataset of over 148 million check-ins across New York City and Los Angeles, the researchers characterize how heterogeneous social data reflections people's physical movements and online sharing preferences.
TL;DR
This study provides a comprehensive empirical analysis of how we interact with cities through our digital footprints. By analyzing 148 million check-ins, 2.7 million photos, and 1.2 million tips from Foursquare, the research reveals that our digital sharing is highly categorized (mostly food!), visually driven, and follows predictable geo-temporal rhythms regardless of whether we are in NYC or Los Angeles.
Background: The City as a Living Sensor
In the era of Big Data, Every "Check-in" is more than just a coordinate; it’s a pulse point of urban life. The authors position Foursquare not just as a social app, but as a Participatory Sensing System. The goal is to understand the interplay between physical visits (check-ins) and qualitative feedback (tips and photos) to build better recommendation engines and urban planning models.
The Core Motivation: Why do we share?
Prior work often treated check-ins as isolated points. This paper delves into the heterogeneous nature of data. The researchers noticed that while a check-in proves you were there, a photo or a tip explains the quality of the experience. They sought to find if these different data types follow the same distribution patterns and how they influence the "social popularity" of a venue.
Methodology: Analyzing the Long Tail
The researchers crawled data from two major hubs: New York City (NYC) and Los Angeles (LA). They categorized venues into 10 primary types (Food, Nightlife, Travel, etc.) and applied statistical measures to observe inter-visit dynamics.
1. The Category Consistency
One of the major insights is that user behavior is remarkably consistent across different cities. Whether in the sprouts of LA or the density of NYC, the distribution of tips, photos, and check-ins across categories follows a nearly identical curve (see Figure 2).
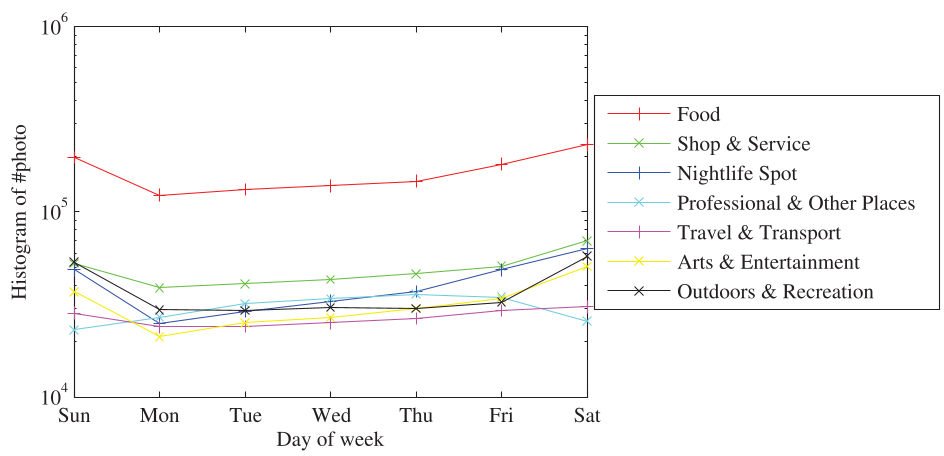 Figure 2: Distribution of tips, photos, and check-ins by venue category in NYC and LA.
2. The Visual Bias
The study highlights a significant shift toward visual consumption. Users are much more likely to post photos than write tips. The "inter-visit time" for photos is significantly shorter than for tips, suggesting that visual sharing is a more spontaneous and frequent activity.
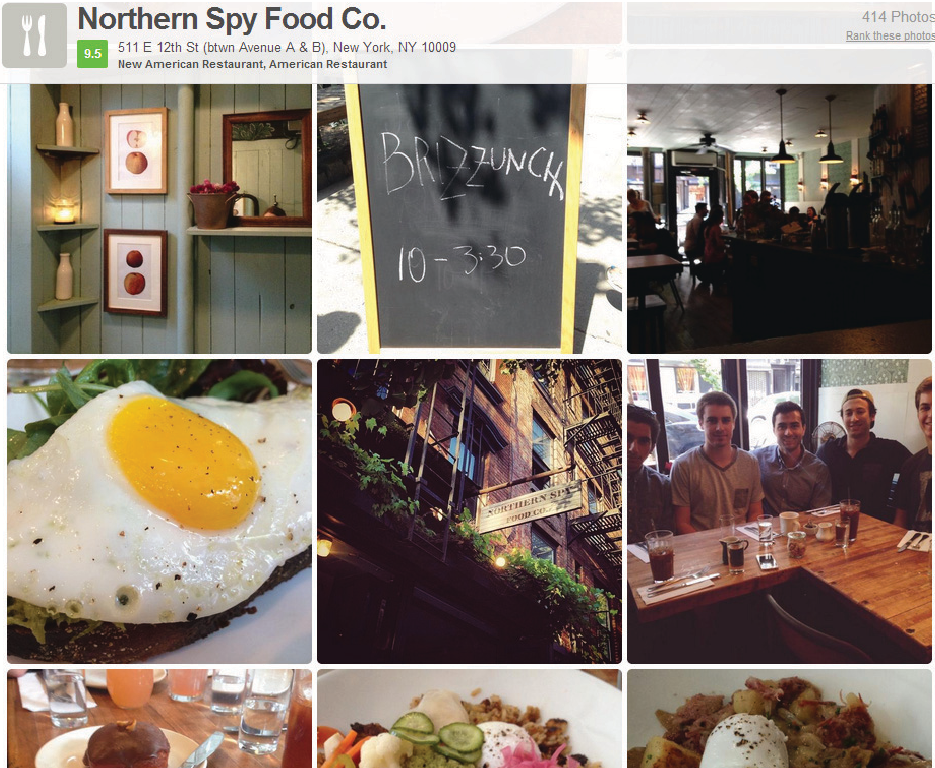 Figure 7: A 3D histogram showing that users generally prefer sharing photos over tips, with the frequency of photos being much higher.
Key Experimental Findings
- The Food Dominance: Food-related venues (Category 4) were the absolute kings of social media, accounting for the highest volume of photos and tips.
- Temporal Rhythms: Arts, Entertainment, and Outdoors peak during weekends, while Professional and Travel categories maintain a steady flow during the work week (see Figures 3 & 4 in the paper).
- Venue Popularity: Photos act as a catalyst. Venues with more photos tend to attract more check-ins, creating a "rich-get-richer" effect in social visibility.
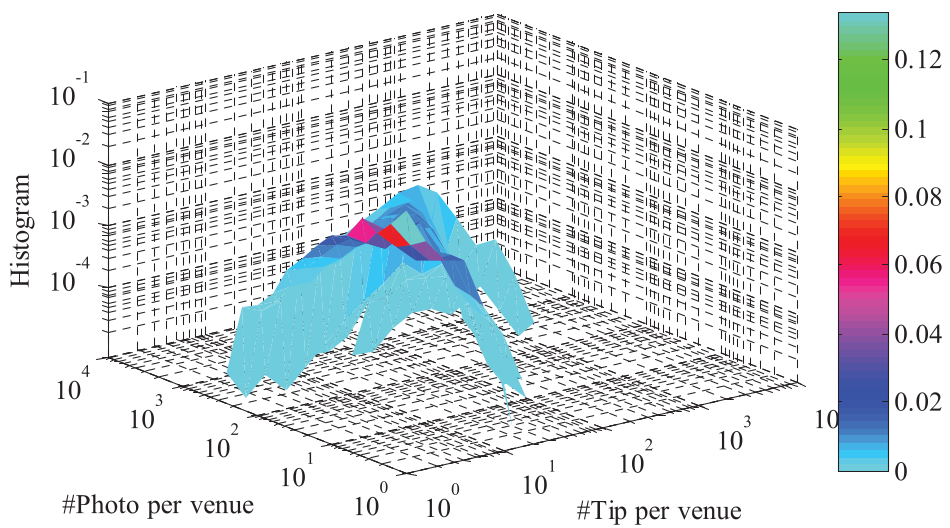 Figure 9: Examples of how venue photos provide immediate visual context of storefronts and interiors.
Critical Insight & Conclusion
The study concludes that venue photos make locations "more social." There is a clear "analogous geo-temporal rhythm" across all forms of heterogeneous data. For developers and researchers, this means that multi-modal data is not just "extra info"—it is foundational.
Takeaway: If you are building a recommendation system, the frequency and content of photos is a more potent predictor of future foot traffic than text-based reviews.
Limitations
While the dataset is massive, it is limited to the US context (NYC and LA) and the Foursquare ecosystem of 2014. Contemporary social dynamics on platforms like Instagram or TikTok might show even tighter inter-visit times and a more extreme visual bias.