
Genkii: Deciphering the Human Element in Spatial Crowdsourcing
An empirical study of workers' behavior in spatial crowdsourcing
This paper presents an empirical study of worker behavior in Spatial Crowdsourcing (SC) through two real-world campaigns in Japan using the "Genkii" mobile app. The authors analyze how different incentive structures impact user retention and explore the correlation between worker mobility patterns and their self-reported affective states.
TL;DR
Researchers from USC and NII Japan conducted a real-world study on Spatial Crowdsourcing (SC) using a custom app, "Genkii." They discovered that Increasing Reward schemes significantly boost worker retention compared to traditional fixed rewards. Furthermore, they established a fascinating link between physical mobility and happiness: the more workers travel, the "happier" the data they contribute.
The "Why": Beyond Algorithmic Efficiency
Most spatial crowdsourcing research focuses on task assignment algorithms—treating workers as predictable variables in a mathematical equation. However, humans are fickle. They get bored, they commute at specific times, and they respond differently to money. This study shifts the focus from "How do we assign tasks?" to "Why do workers stay, and how does their lifestyle affect the data?"
Methodology: Gestures, Gains, and Geofences
The authors utilized the Genkii app, which uses physical gestures (Circle for Happy, Triangle for OK, Cross for Dull) to collect data. This "playful" input serves as a form of lightweight gamification.
The Reward Experiment
To test the impact of incentives, two campaigns were run on the Yahoo! Japan Crowdsourcing platform:
- Fixed Reward (FR): 20 points per task.
- Increasing Reward (IR): Starting at 2 points and scaling up to 50 points.
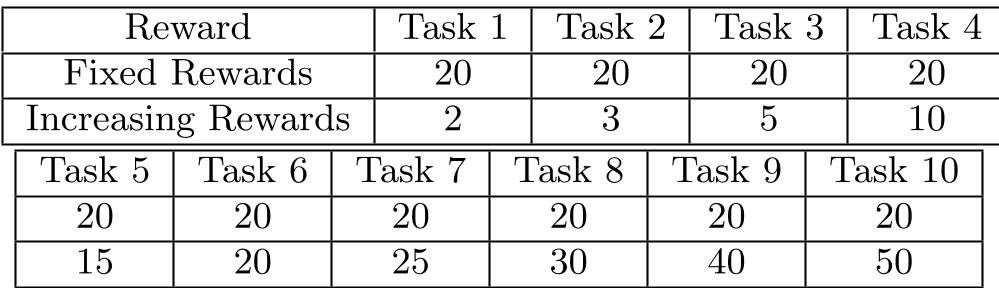 Table 1: Comparison of Fixed vs. Increasing reward structures.
Key Findings: The Power of Proximity and Progression
1. Retention: The "IR" Advantage
The study confirmed a massive initial "on-boarding" hurdle: 40% of users quit after a single report. However, the Increasing Reward scheme acted as a powerful hook. By offering a "crescendo" of rewards, user retention for completing all 10 tasks jumped from 11.3% up to 17%.
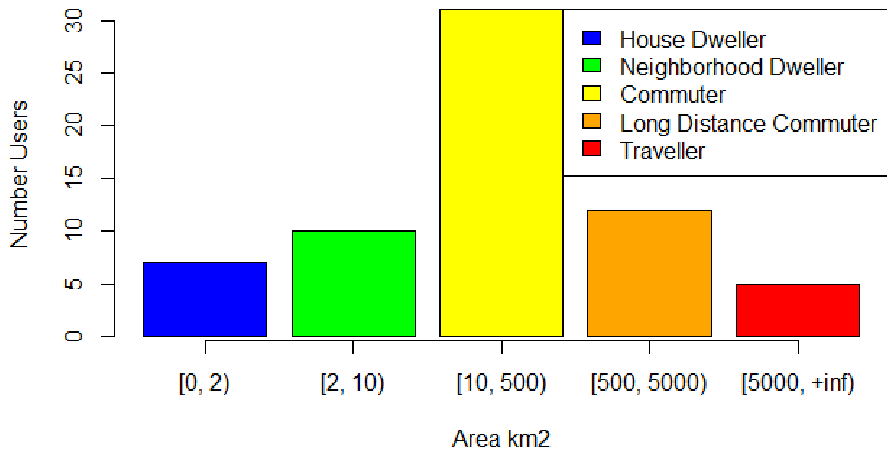 Figure 6: The drop-off is much steeper for fixed rewards than for increasing rewards.
2. Spatiotemporal Cycles
Reporting followed the cultural rhythm of Japan. Peaks occurred at 4 AM, 12 PM, and 8 PM (times of rest or meals), while lows occurred during 9 AM and 5 PM (commute times). This suggests that SC tasks should be timed to coincide with "micro-moments" of worker downtime.
3. The Mobility-Happiness Correlation
Perhaps the most striking finding is the categorization of workers by their "Genkii Territory" (MBR).
- House Dwellers (< 2km²): Reported being "Dull" at a rate of 43%.
- Long Distance Commuters (500-5000 km²): Reported being "Happy" 57% of the time.
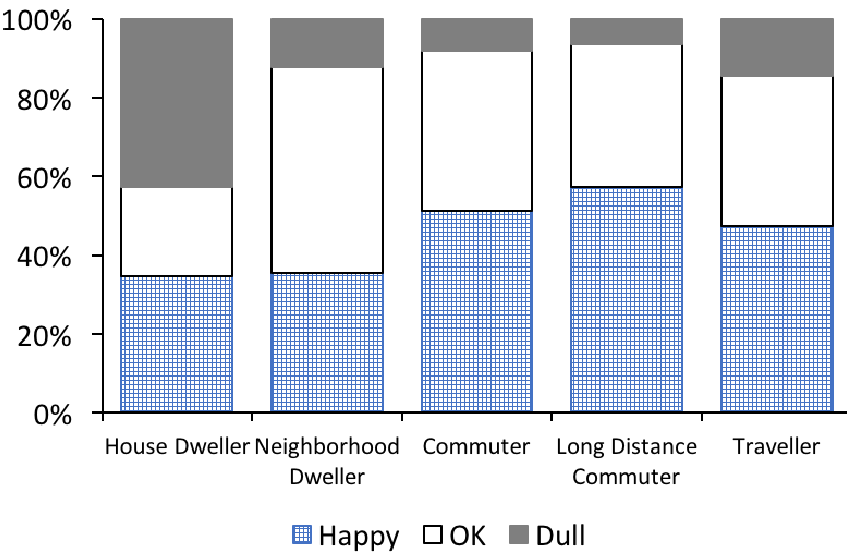 Figure 10: As the 'territory' size increases, the reported happiness levels trend upward.
Critical Insight & Future Outlook
The study highlights an Inductive Bias in crowdsensed data: "Travellers" are more likely to participate and report positive states, while "Dwellers" are more stationary and prone to negative reports. For platforms like Waze or Gigwalk, this means that the location of a worker might inherently bias the quality and tone of the data they provide.
Limitations: The gesture recognition for "Dull" (Cross) had a lower F1-score (0.70) due to similarity with the "OK" (Triangle) gesture, suggesting that physical UI design is critical for data accuracy in SC.
Conclusion: To build successful SC markets, organizers should adopt progressive incentives and account for the mobility-driven emotional bias of their workforce. The future of SC lies in "gamifying" the physical world while respecting the natural spatiotemporal rhythms of the crowd.