
Behind the Screen: Unveiling the Hidden Energy Cost of Photo Sharing
Energy Consumption of Photo Sharing in Online Social Networks
This paper presents a comprehensive energy model for photo sharing in Online Social Networks (OSNs), specifically Facebook. It investigates the often-overlooked energy consumption of transport networks and end-user devices, establishing that these components significantly impact the total carbon footprint of cloud services.
TL;DR
While big tech companies often boast about their "green" data centers, a significant portion of the energy used to post and view photos happens right in your hand and within the network cables between you and the server. This paper reveals that the transport network and user devices consume roughly 60% as much energy as all Facebook data centers combined for photo sharing tasks alone.
The Missing Piece of the Green Cloud Puzzle
In the academic and corporate discourse on "Green Computing," the spotlight is usually on PUE (Power Usage Effectiveness) and cooling systems within massive data centers. However, this focus creates a blind spot.
The authors argue that a cloud service is a three-part system:
- The Data Center: Storage and processing.
- The Transport Network: Edge routers, core routers, and optical links.
- End-User Devices: Your laptop or smartphone.
By ignoring the latter two, previous research significantly underestimated the energy footprint of digital social interactions.
Methodology: Calculating the "Incremental" Cost
The genius of this paper lies in its Incremental Energy Model. Instead of just measuring total power, the authors ask: How much extra energy is consumed specifically because you uploaded this 5MB photo?
They categorize hardware into two types:
- Single-User Elements (CPE): Like your home router. These have high "idle" power. Even if you aren't using them, they are on. The authors only count the extra power spike caused by the data transfer.
- Shared Network Elements: Like core routers. The authors use a "staircase" model to account for how operators add more equipment as total traffic increases over time.
The Network Architecture
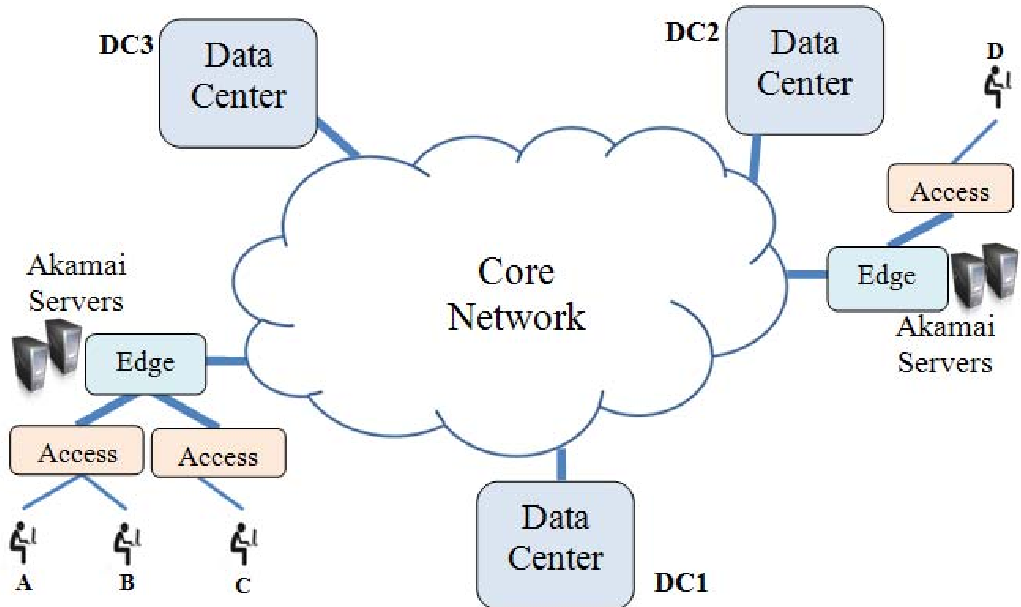 Fig 1: The journey of a photo from User A to Friends B, C, and D.
Real-World Measurements: The Facebook Case Study
The authors didn't just use math; they performed empirical experiments using Wireshark and power meters.
- Compression is King: They discovered Facebook heavily compresses photos in the browser before they are sent. A 5MB photo might only result in 500KB of network traffic.
- Mobile Inefficiency: Using 4G/LTE to upload a photo consumes significantly more energy than WiFi. Specifically, the "energy-per-bit" for an LTE base station was found to be orders of magnitude higher than fixed-line Ethernet switches.
Energy Breakdown by Hardware
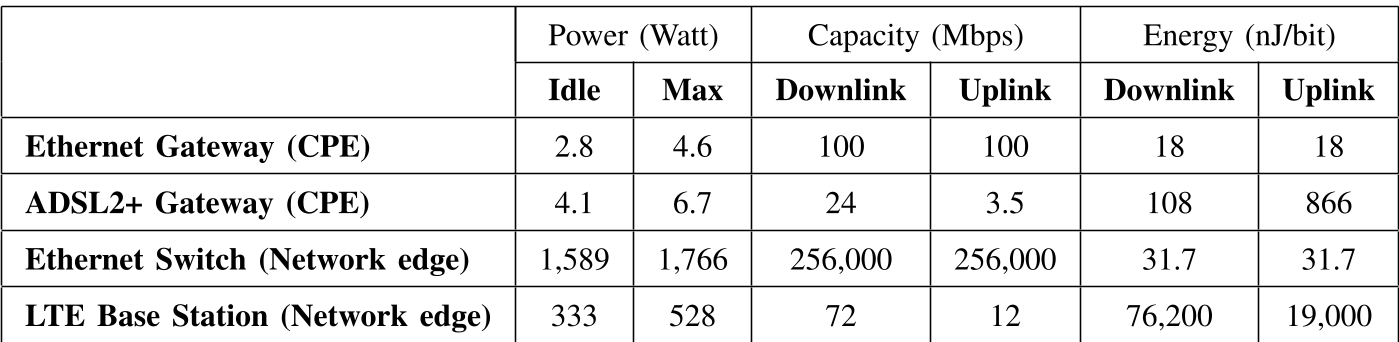 Table 1: Comparison of power and capacity across different access technologies.
The Verdict: 304 Gigawatt Hours
When scaling their findings to a year's worth of Facebook activity, the numbers are staggering.
- Uploads: Consume roughly 12.5 GWh/year.
- Downloads: Because one photo is viewed by many friends (the "Fan-out" effect), downloads consume a massive 292 GWh/year.
The total (304 GWh) is roughly 60% of the 500 GWh that Facebook reported for its entire data center IT facilities in 2012.
Annual Energy Distribution
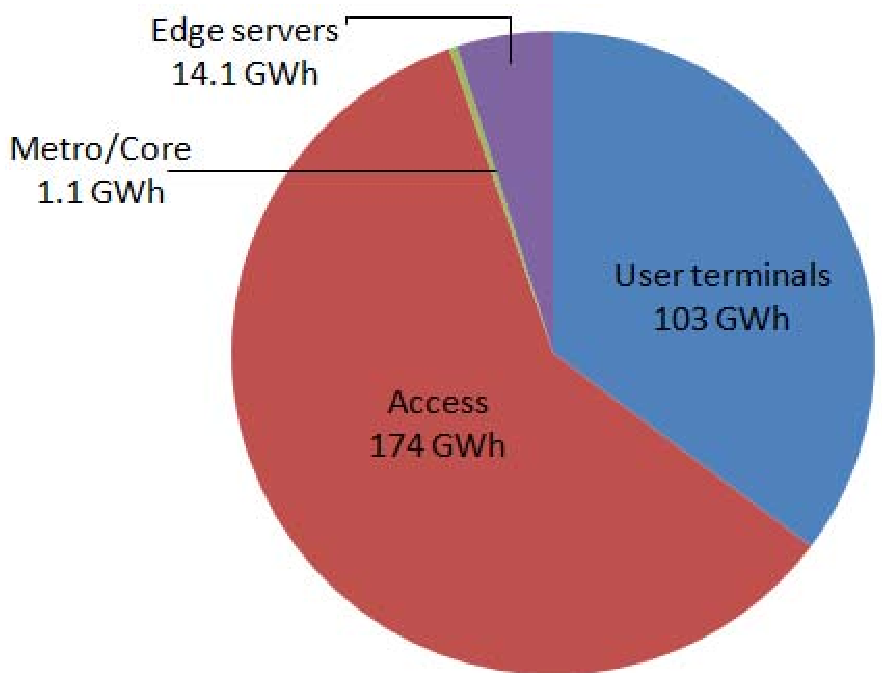 Fig 2: Majority of energy is consumed in the access network and end-user devices.
Critical Insight & Future Outlook
This paper serves as a wake-up call for "Full-Stack Green Design."
- WiFi vs. Cellular: The environmental cost of using 4G/LTE is drastically higher than WiFi. Moving towards small cells and WiFi hotspots is not just a performance upgrade; it's an environmental necessity.
- CDN Value: The use of Akamai and internal CDNs (like Facebook's Haystack) is vital. By moving data closer to the user, we bypass the energy-hungry core network routers.
- Limitations: The study was conducted in the 4G era. With the advent of 5G and more power-hungry AI-enhanced image processing on smartphones, the "End-User Device" slice of the pie is likely even larger today.
Takeaway: To build a truly sustainable internet, we must look beyond the server rack and consider the entire path to the palm of the user's hand.