
Beyond the Bottom Line: Simulating the Health and Environmental Toll of Energy Portfolios
Energy portfolio simulation considering environmental and public health impacts
The paper introduces a System Dynamics (SD) simulation model designed to evaluate regional energy portfolios by integrating traditional economic metrics with environmental and public health impacts. Applied to the U.S. Hampton Roads-Peninsula region, the model assesses the trade-offs between conventional thermal power and renewable sources, focusing on particulate matter (PM2.5) and its correlation with asthma rates.
TL;DR
Researchers at Old Dominion University have developed a System Dynamics model that proves the "cheapest" energy source is often the most expensive when public health and environmental externalities are factored in. By simulating the link between thermal power emissions and asthma rates in Virginia's Peninsula region, this work provides a framework for building energy portfolios that maximize "Scored Net Benefit" rather than just profit.
Background: The Hidden Costs of the Grid
For decades, the "Least Cost Approach" has dominated energy planning: build the plant with the lowest standalone production cost (usually coal or gas). However, this ignores the externalities—the costs of respiratory distress, hospitalizations, and environmental decay borne by the public. This paper argues that in an era of heightened environmental awareness and fluctuating fuel prices, we need a simulation-based approach to capture the "Why" behind public opposition and the "How" of sustainable transition.
Methodology: A Holistic Feedback Loop
The researchers moved beyond static spreadsheets to a System Dynamics (SD) model. SD is uniquely suited for this task because it handles feedback loops—such as how increased pollution leads to higher healthcare costs, which in turn reduces regional wealth and alters public perception of energy providers.
The Core Framework
The model is built on four pillars:
- Regional Demand/Supply: Balancing local production with the economic drain of importing electricity.
- Key Portfolio Attributes: Rating sources (Fossil, Nuclear, Renewable) on reliability, cost, and "viewscape" (e.g., the visual impact of wind turbines).
- The Health Engine: A regression-based module that translates fuel consumption into PM2.5 emissions and subsequently into asthma discharge rates.
- The Scoring Scheme: A weighted "Scored Net Benefit" that serves as a proxy for public support.
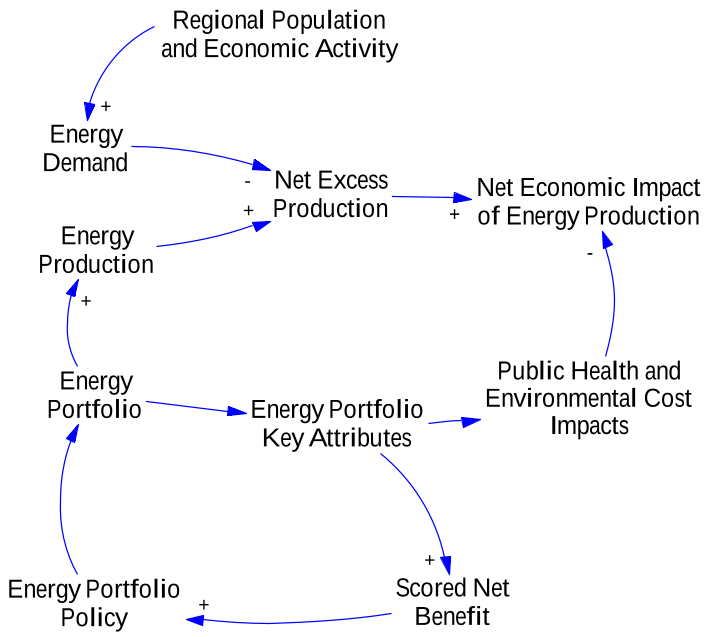 Figure 1: The architecture of the evaluation model showing the interplay between the energy portfolio and regional attributes.
Experimental Validation: Hampton Roads Case Study
The team calibrated the model using data from the Hampton Roads region (1996-2002), home to the Yorktown coal-fired plant.
Key Findings:
- Emission Accuracy: The model’s simulated PM2.5 emissions and power generation closely matched historical records, validating the regression approach.
- The Asthma Paradox: Interestingly, while emissions from the power plant increased during the study period, the asthma discharge rate trended downward. The model helped explain this by identifying a significant reduction in mobile-source emissions (vehicular traffic) during the same window, which outweighed the point-source pollution from the plant.
- Economic Impact: The region suffered a negative economic impact primarily because it remained a net importer of electricity, highlight the dual benefit of local renewable development: energy independence + lower health costs.
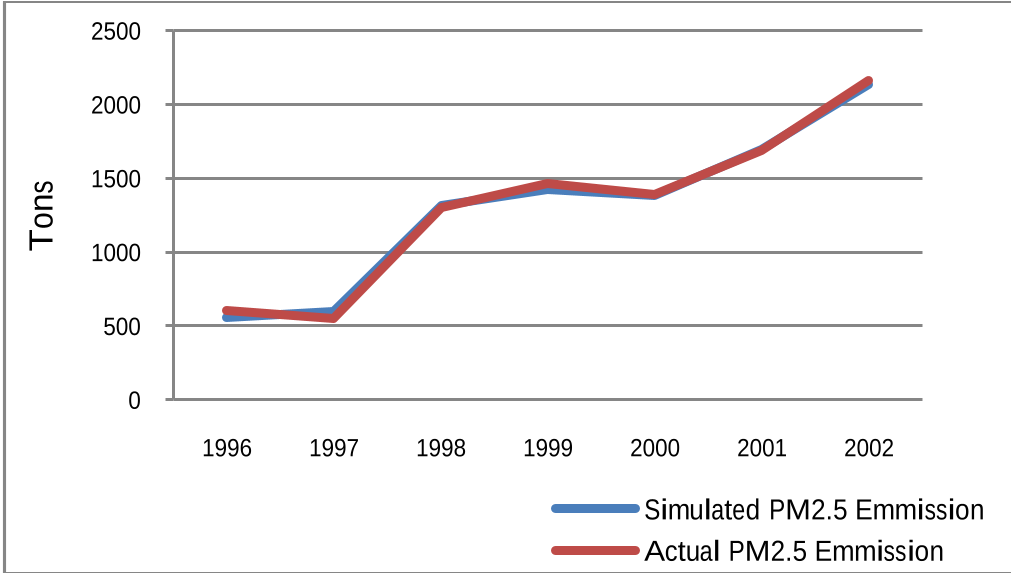 Figure 2: Validation of health impacts showing a reasonable trend-wise match between real-world asthma data and simulation results.
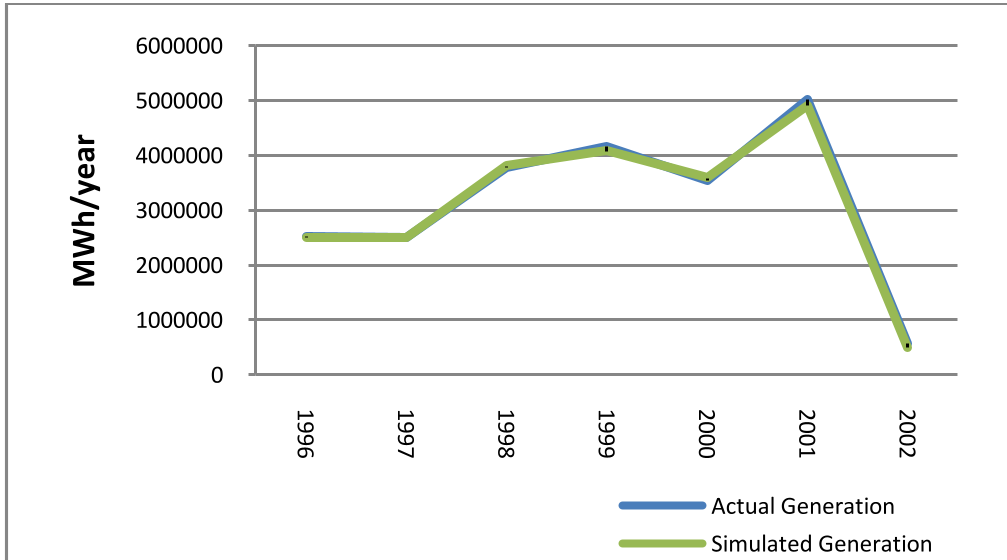 Figure 3: Power generation simulation showing high fidelity to historical utility output.
Critical Insight: Why This Matters for Policy
The paper’s most potent contribution is the Scored Net Benefit. By quantifying "fuzzy" metrics like viewscape degradation and property value shifts alongside hard health data, the model provides a "communication strategy" for policymakers. It allows them to show the public why a more expensive renewable portfolio might actually save the community millions in the long run by reducing the "cost to society."
Limitations & Future Work
While a breakthrough for 2011, the model is limited by its focus on asthma as the sole health proxy. The authors suggest that future iterations should include a broader spectrum of secondary effects (such as cardiovascular issues) and expand the logic to model the specific environmental footprints of nuclear and biomass energy.
Conclusion
This research marks a shift toward environmentally sustainable decision-making. By treating the public not just as consumers of electricity, but as stakeholders in regional health, the System Dynamics approach offers a path toward energy portfolios that are both economically viable and socially responsible.