
Deciphering the Carbon Footprint of Food Logistics: A Data Mining Approach
Environmental Impact Classification of Perishable Cargo Transport Using Data Mining
The study presents a classification model for the environmental impact of perishable cargo transport in Brazil using Random Forest data mining. By analyzing variables such as distance, product type, and quantity, the model categorizes Global Warming Potential (GWP) into low, medium, and high levels to guide sustainable logistics decisions.
TL;DR
Researchers have developed a predictive framework using Random Forest algorithms to classify the environmental impact of transporting vegetables across Brazil. By analyzing data from "Nova Ceasa," the study identifies how specific sourcing routes (like tomato transport from Goiás) drastically increase Global Warming Potential (GWP), offering a 75% accurate roadmap for green procurement.
The Logistics Dilemma in Continental Nations
In massive territorial countries like Brazil, the "Road Modal" is the backbone of the economy. However, this reliance comes at a steep environmental price. For perishable goods—tomatoes, lettuce, bell peppers—the distance between the farm and the consumer isn't just a cost factor; it’s a climate factor.
The core challenge lies in the complexity of the data: emissions are a moving target influenced by fuel consumption, load weight, and the geographical origin of the product. Traditional linear models often fail to capture the nuanced thresholds where a "medium" impact route turns into a "high" impact disaster.
Methodology: From Raw Data to Decision Trees
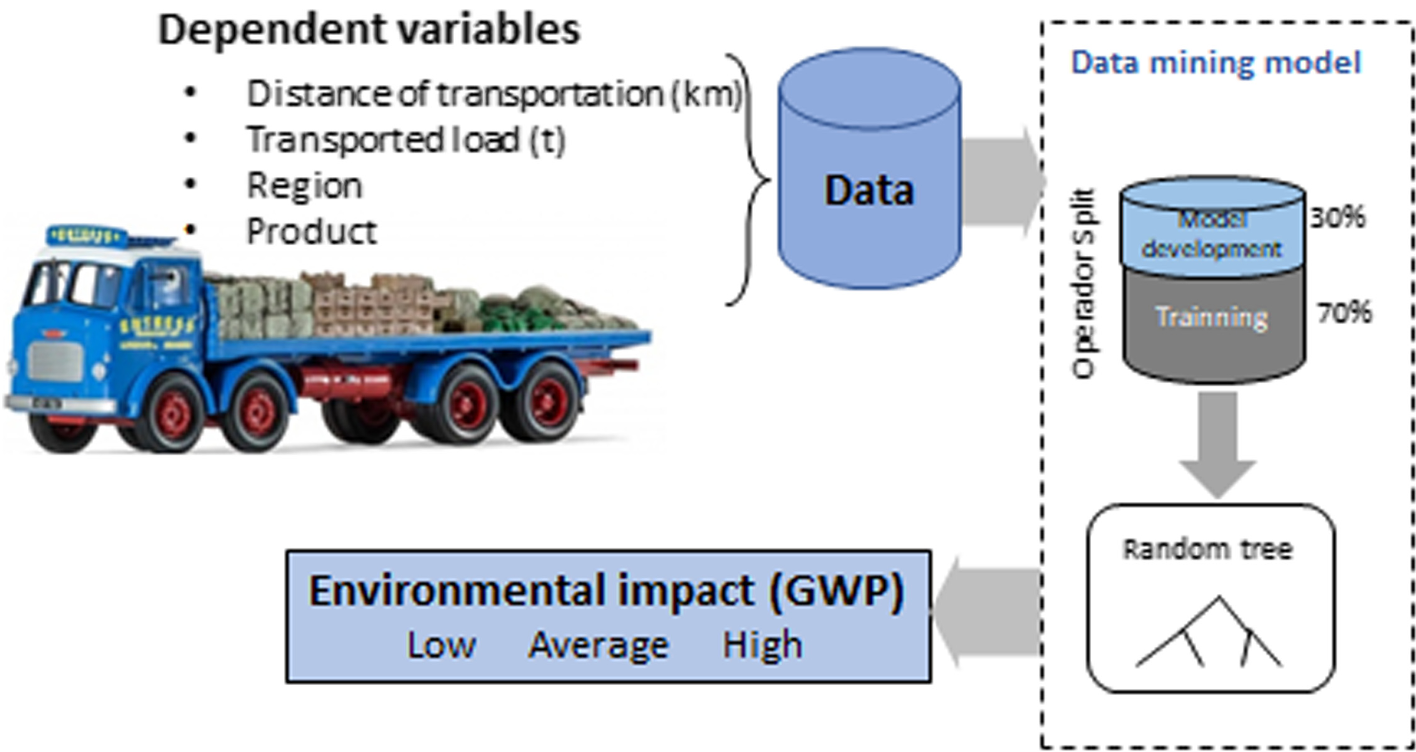
The researchers utilized RapidMiner Studio to process data from the first ten months of 2019. The workflow followed a rigorous data mining pipeline:
- Data Acquisition: Distance, fuel consumption (avg. 10 L/km), and cargo quantity.
- Feature Engineering: Calculating CO2-eq emissions and GWP, then discretizing them into "Low," "Average," and "High."
- Model Training: Using a Random Forest classifier, which builds an ensemble of decision trees to provide robust predictions.
The Analytical Framework
The logic of the study is encapsulated in the following processing scheme, which balances training data against validation to ensure the model generalizes well to new logistical scenarios.
Core Insights: The "High Impact" Culprits
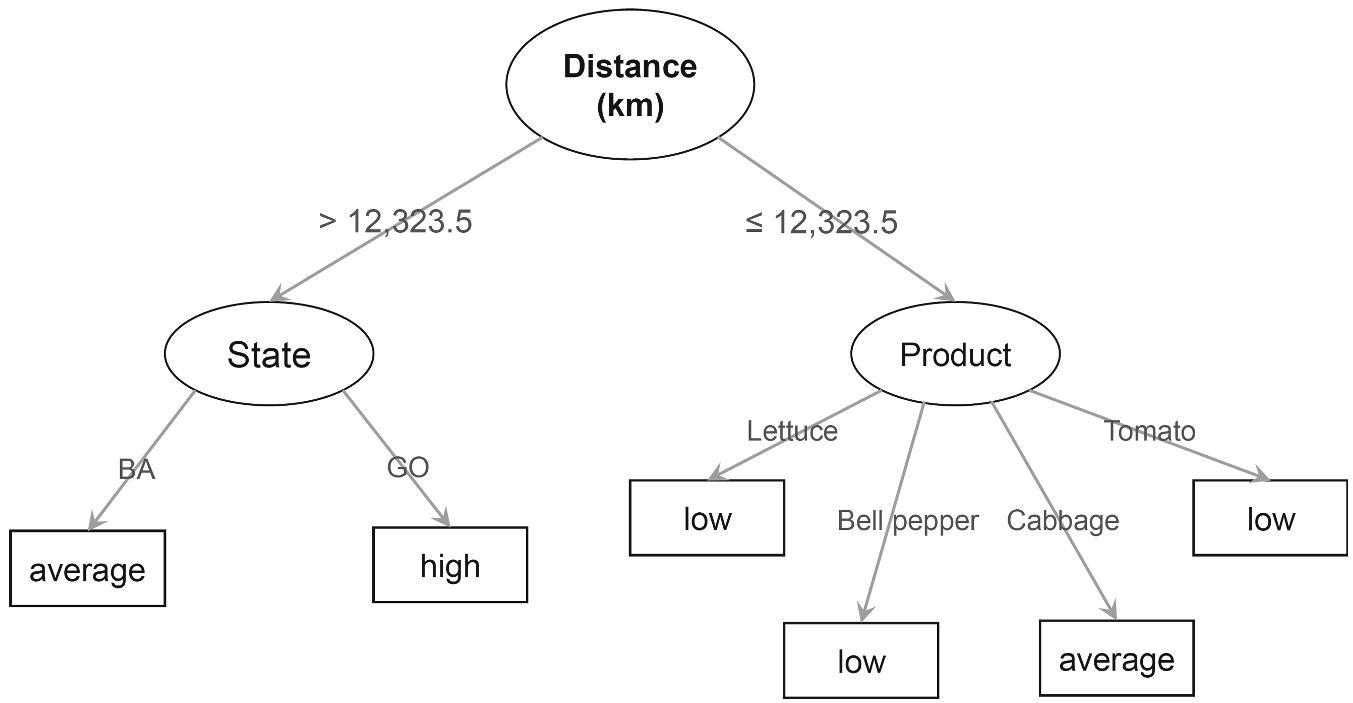
The study’s findings are most visible through its generated decision trees. By focusing on variables like distance and product type, the model clarifies exactly when a supply chain becomes unsustainable.
- The Distance Threshold: The model identified a critical distance of 12,323.5 km (cumulative/representative scale in the dataset). Below this, most greens like lettuce and cabbage remain "Low" impact.
- The Tomato Case Study: Sourcing tomatoes from the State of Goiás (GO) consistently triggered "High" impact classifications, whereas Pernambuco (PE) offered a much leaner environmental profile.
Experimental Results & Accuracy
The Random Forest model achieved a 75% accuracy rate. In the context of "dirty" real-world logistical data, this is a significant result that allows for reliable predictive planning.
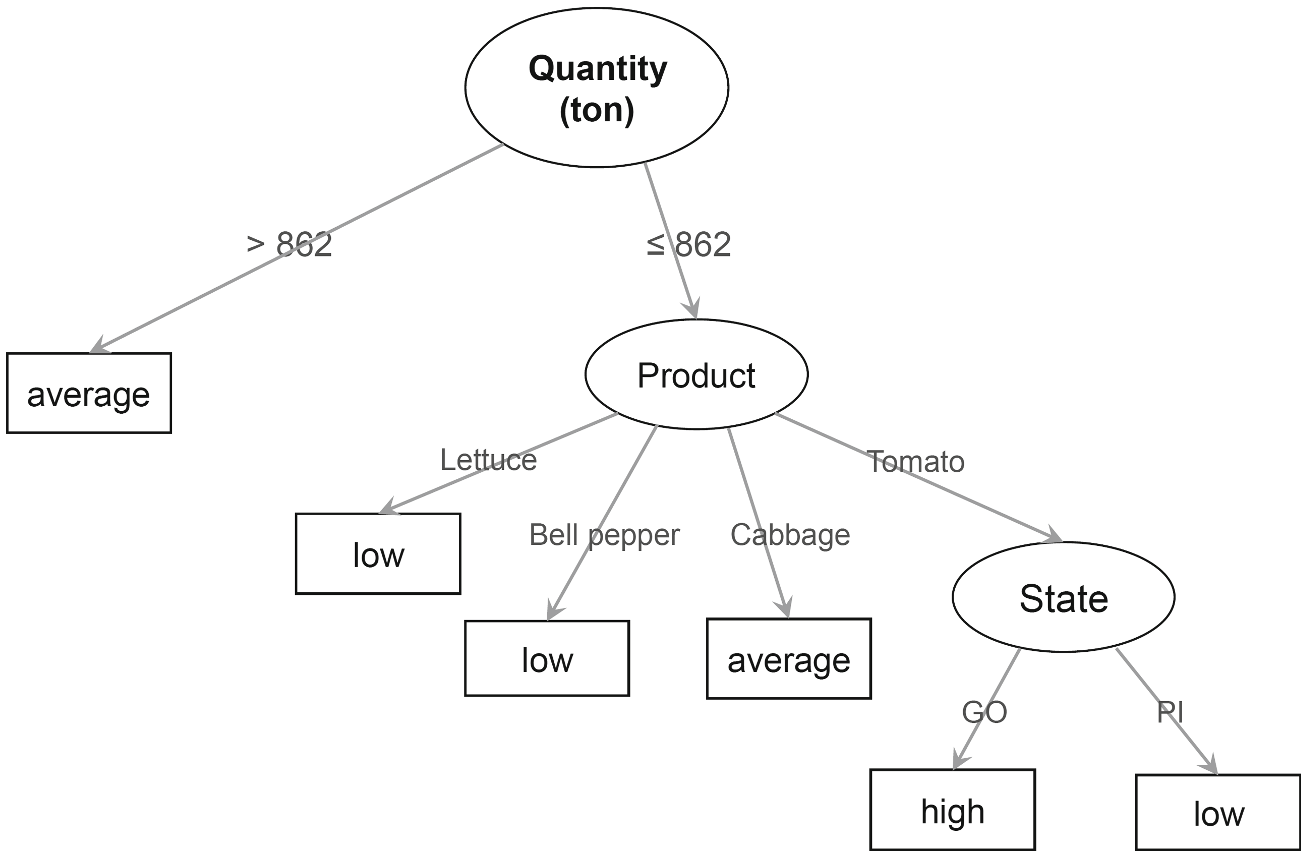
- Quantity Matters: When the quantity transported exceeds 862 tons, the GWP often shifts from "Low" to "Medium," highlighting that scale does not always equal efficiency if the distance is too great.
- Localism is Key: The model objectively confirms the "local food" hypothesis—reducing the physical distance between producer and distributor is the single most effective way to lower GWP.
Critical Analysis & Conclusion
Takeaway
This research moves environmental impact assessment from the realm of "after-the-fact" reporting into proactive decision support. By using These decision trees, procurement managers at distribution centers like Nova Ceasa can prioritize suppliers not just based on price, but on their classified environmental tier.
Limitations & Future Work
While the model is robust, it primarily focuses on the "on-road" phase. Future iterations could benefit from:
- Real-time fuel efficiency data: Accounting for vehicle age and road conditions.
- Waste Analysis: Incorporating the environmental cost of food spoilage during long-haul transport.
- Broader Scope: Expanding beyond five vegetable types to include the full spectrum of perishables.
In conclusion, as governments strive for massive emission cuts by 2050, data mining provides the surgical precision needed to trim the carbon fat from our global food supply chains.