
Predicting Olive Fly Outbreaks: A Data-Driven Approach to Precision Agriculture
Environmental Impact on Predicting Olive Fruit Fly Population Using Trap Measurements
This paper presents a machine learning-based approach to predict olive fruit fly (Bactrocera oleae) populations using localized environmental data and historical trap measurements. By employing algorithms like SMO and AdaBoost, the study achieves a significant performance leap in predicting pest outbreaks, which is critical for precision olive grove management.
TL;DR
Researchers have developed a machine learning framework to predict olive fruit fly populations—a major threat to olive oil production—by analyzing localized temperature patterns and historical trap data. The study demonstrates that using discretized environmental features allows Support Vector Machines (SMO) to outperform previous ecological models by 10% in recall, providing a more reliable "early warning" system for farmers.
Background & Motivation: The Ancient Pest Meets Modern Data
The olive fruit fly has been a scourge of Greek agriculture since antiquity. While modern farmers use bait sprays to control populations, timing is everything. Spraying too early is wasteful; spraying too late leads to ruined harvests.
The core challenge lies in the Inductive Bias of current models. Most existing systems rely on tree health (phenological state), which is slow to change. However, fly activity is acutely sensitive to daily temperature and humidity. The authors of this paper pivot from broad "health" metrics to high-resolution environmental data, seeking to capture the immediate atmospheric triggers of a population boom.
Methodology: Translating Biology into Features
The researchers deployed sensors across 16 locations on Corfu island, logging temperature every 15 minutes. To make this data "machine-learnable," they engineered a feature vector that includes:
- Moving averages of temperatures over a 5-day window.
- Categorical bins based on biological limits: Temperatures below 15°C and above 32°C render the fly motionless.
- Historical Trap counts: Quantized into thresholds (0-4, 5-6, and >=7) that signal when chemical intervention is required.
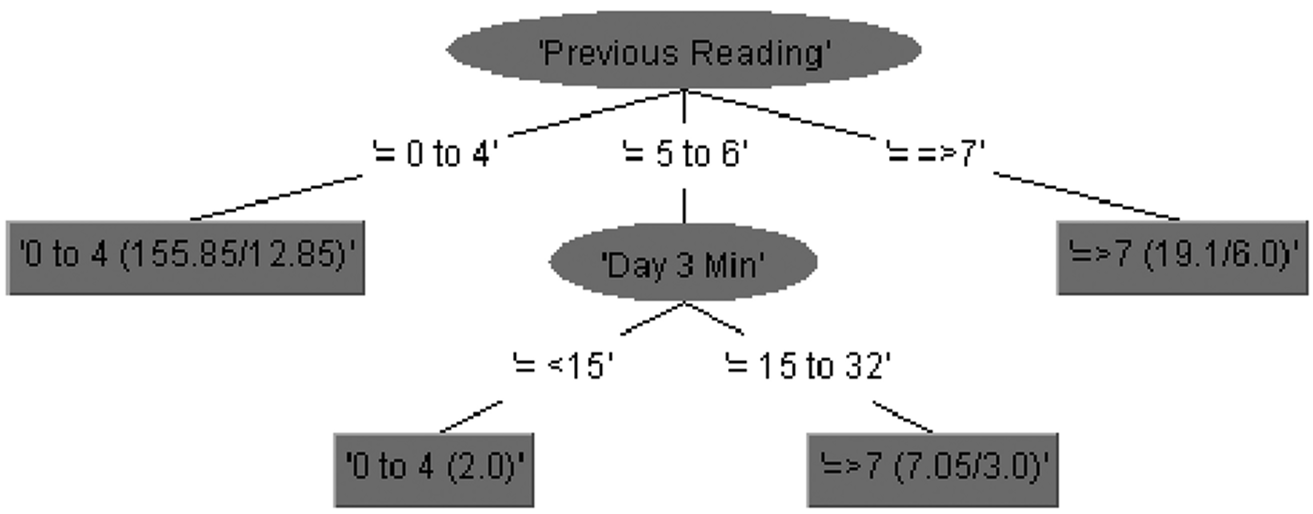 The J48 Decision Tree highlights that "Previous Reading" is the strongest indicator, with temperature acting as a secondary filter for specific infestation levels.
Experiments and Results
The study compared several heavy hitters in the classification world: Random Forests, Naive Bayes, Multilayer Perceptrons (MLP), and Sequential Minimal Optimization (SMO).
Key Findings:
- Winner: The SMO algorithm (a fast SVM variant) and AdaBoostM1 provided the highest accuracy and recall.
- Recall Boost: By focusing on environmental variables rather than tree health, the model achieved a 10% improvement in recall over previous benchmarks (see figure below).
- Data Sensitivity: The IBk (k-Nearest Neighbor) algorithm peaked in performance at , suggesting that pest spikes are highly localized and context-dependent.
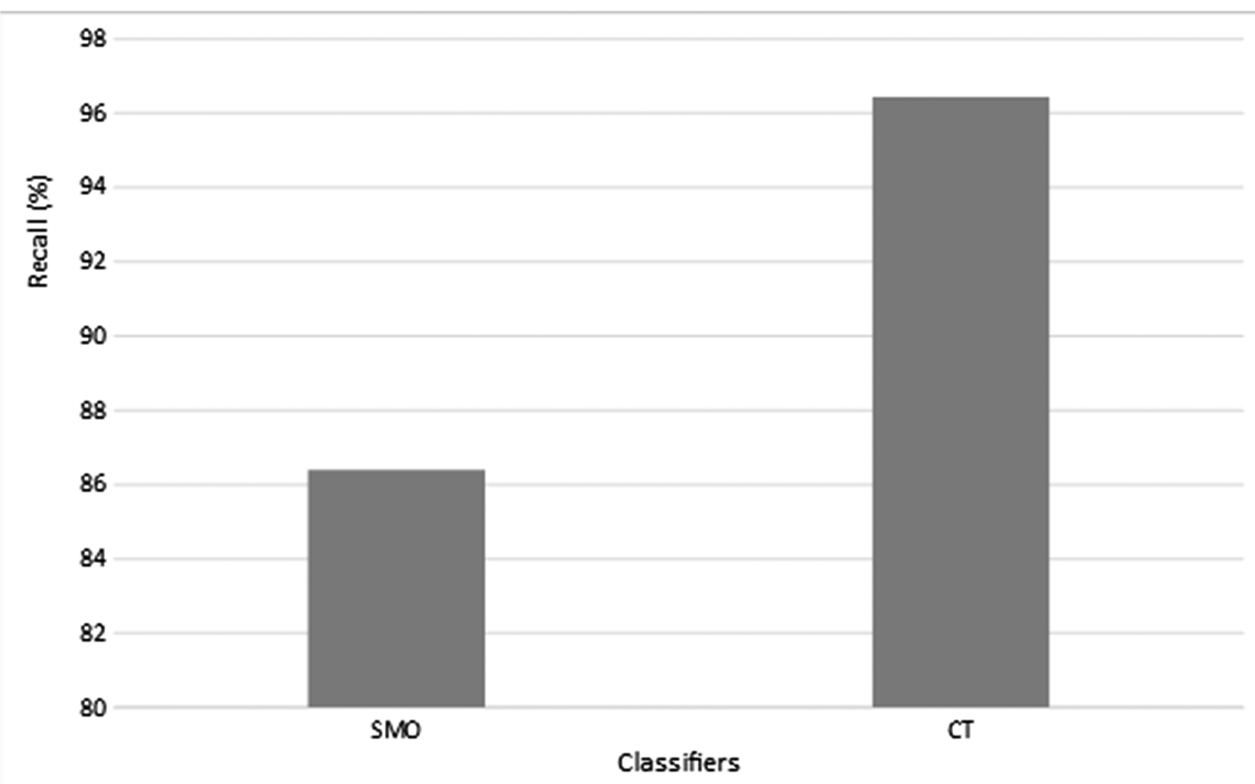 Comparison of current results against previous work [13], showing the superior recall of the environmental-feature approach.
Critical Insights: Dealing with Imbalance
One of the paper's most honest observations is the struggle with Class Imbalance. Over 80% of the recorded data represented low fly counts. This makes it difficult for algorithms like J48 to "learn" the rare but catastrophic event of a high-infestation spike (the 5-6 and >=7 bins). The success of SMO in this context is significant, as it effectively handled the non-linear boundaries between safe and infested states better than traditional decision trees.
Conclusion and Future Outlook
This work marks a shift toward Agri-Tech 4.0, where the "eye" of the farmer is supplemented by IoT sensors and Support Vector Machines.
Future Directions:
- Beyond Temperature: Integrating relative humidity and light intensity to map the fly's survival more accurately.
- Expanding the Dataset: As measurements accumulate over several seasons, Deep Learning models (like LSTMs or Transformers) could be employed to capture long-term seasonal trends.
For the olive oil industry, this method offers a path toward reducing chemical usage while maximizing protection, proving that sometimes the best way to understand a pest is to watch the thermometer.