
The Politics of Bits: How Government Open Data Portals Reveal Environmental Priorities
Patterns in environmental priorities revealed through government open data portals
2021-07-17
Summary
Problem
Method
Results
Takeaways
Abstract
The study employs statistical regression and NLP-based machine learning (Random Forest) to analyze 49,066 datasets from 81 US government Open Data Portals (ODPs). It characterizes how environmental priorities vary across jurisdictional scales and political ideologies, identifying distinct patterns in data types between municipal and state levels.
## TL;DR
Is open data truly "open," or is it a curated reflection of political will? This study analyzes nearly 50,000 datasets across the US to prove that what a government chooses to measure—and share—depends heavily on whether they are a city or a state, and whether they lean liberal or conservative. While cities focus on "livability" (parks and trees), states focus on "resources" (oil and gas), and liberal leanings are the strongest predictors for tracking climate performance.
## Problem & Motivation: Data as a Political Mirror
The explosion of Open Data Portals (ODPs) was promised as a revolution in transparency and "Smart City" efficiency. However, the author argues that data collection is not a neutral act. Drawing from the concept of "wicked" socio-environmental problems, the paper suggests that the framing of environmental issues is a function of political power.
The core tension lies in the **Institutional Fit**: does the scale of data collection match the scale of the environmental challenge? Or does the data simply represent the "Ecosystem" of a specific political administration's interests? Prior research has looked at the *number* of datasets, but this study dives into the *meaning* of the metadata.
## Methodology: Classifying the Environment
The researcher utilized a dual-track approach to analyze 49,066 data objects from 17 states and 64 municipalities.
1. **Manual Coding**: Data was sorted into nine categories ranging from "Environmental Hazards" to "Environmental Performance."
2. **Machine Learning (NLP)**: Using a Random Forest classifier, the author tested "separability"—basically, can an algorithm guess if a dataset is from a city or a state just by its description?
### The Research Pipeline
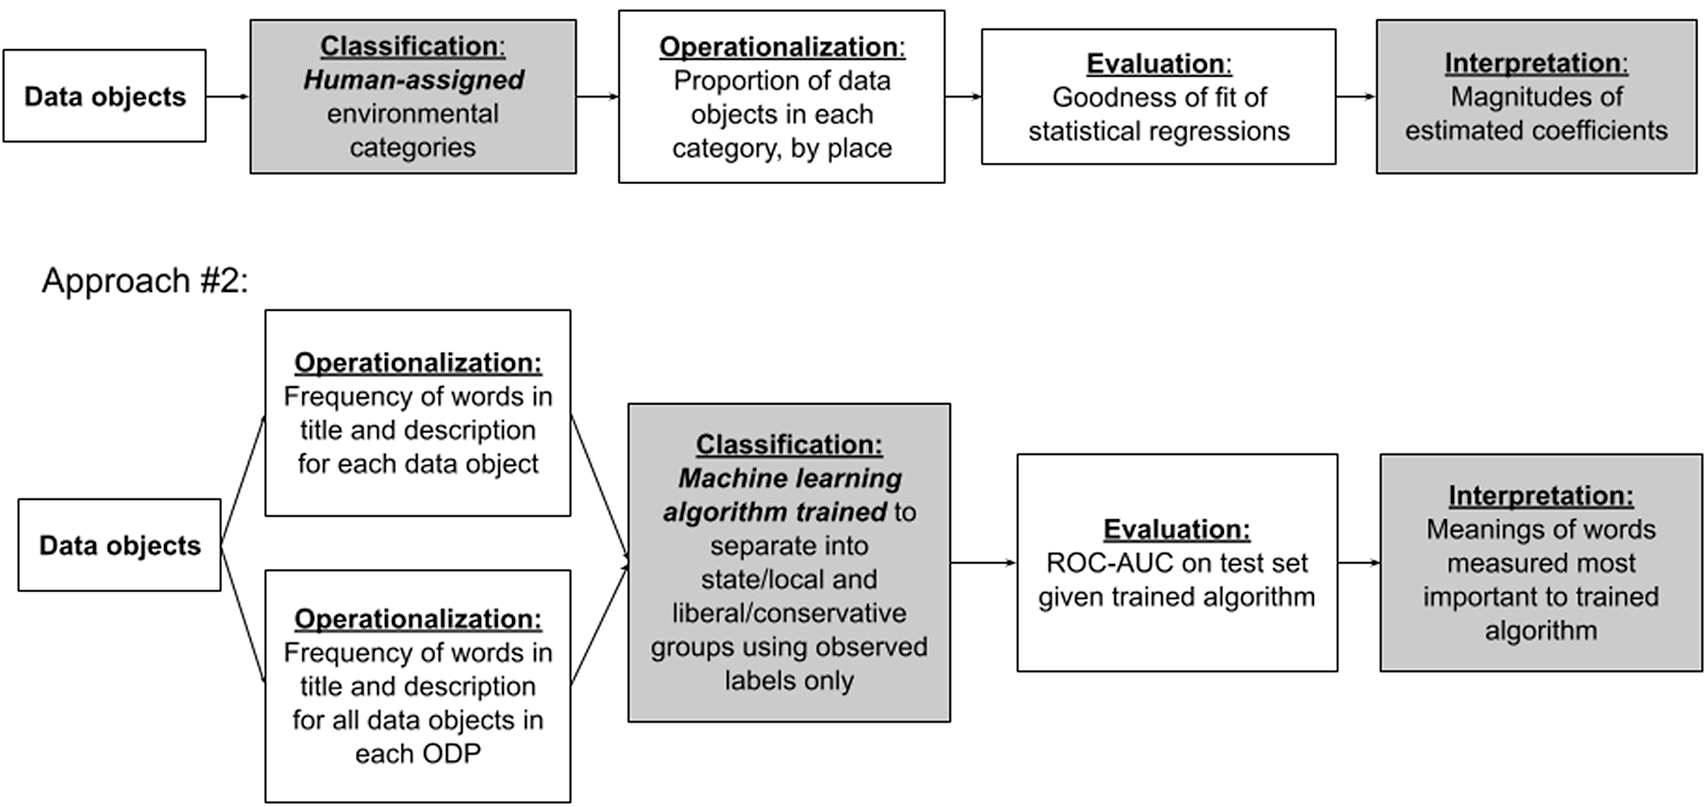
The NLP model was remarkably successful, reaching an **ROC-AUC of 0.91** for state/municipal separation, proving that the language used by different levels of government is distinct and predictable.
## Methodology Detail: The Thematic Framework
The study uses a hierarchy of environmental conceptualization (Table 2 in the paper) that evolves from basic conditions to normative "Performance" and "Equity" measures.
| Category | Typical Keywords Identified |
| :--- | :--- |
| **Amenities/Services** | Park, recreation, tree, sewer, trash |
| **Performance/Programs** | Emissions, GHG, energy efficiency, LEED |
| **Resources** | Oil, gas, coal, mining, production |
## Experiments & Results: Scale and Ideology
The findings confirm that "Place" dictates "Priorities":
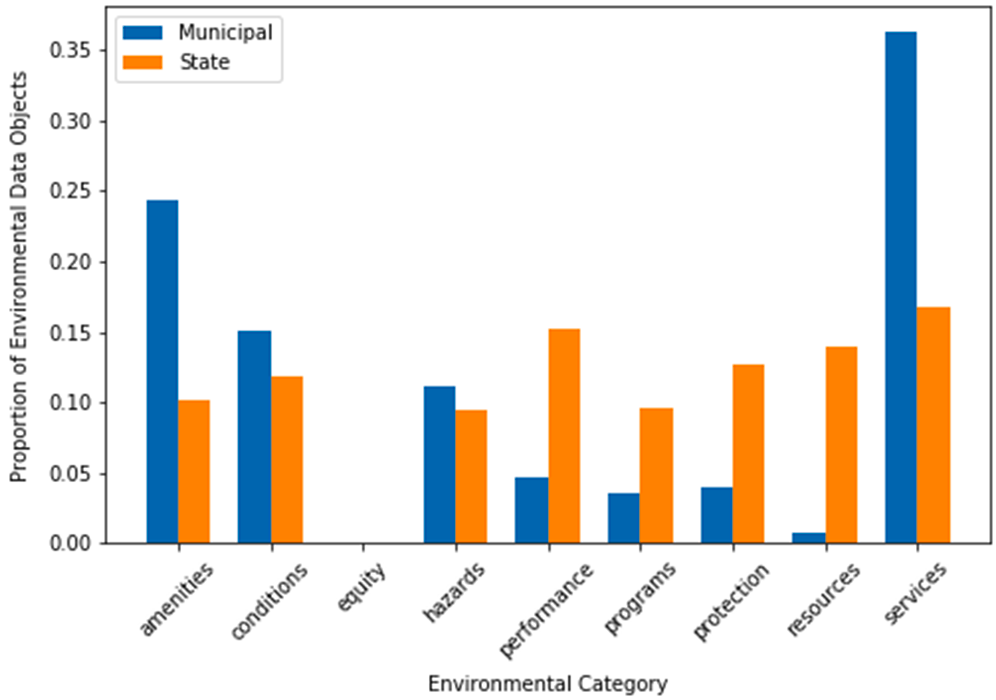
* **Scales of Governance**: Municipalities are the champions of "Environmental Amenities" (Parks) and "Services" (Trash collection). In contrast, states are far more focused on "Resources" and "Protection"—highlighting their role as regulators of extractive industries.
* **The Liberal-Performance Correlation**: Liberal jurisdictions (like San Francisco or Washington D.C.) are statistically more likely to host "Performance" data. This includes tracking greenhouse gas inventories and energy benchmarks.
* **The Conservative-Extraction Focus**: Conservative states were strongly predicted by words like "production," "well," "mining," and "gas."
### Visualizing the Data Gap
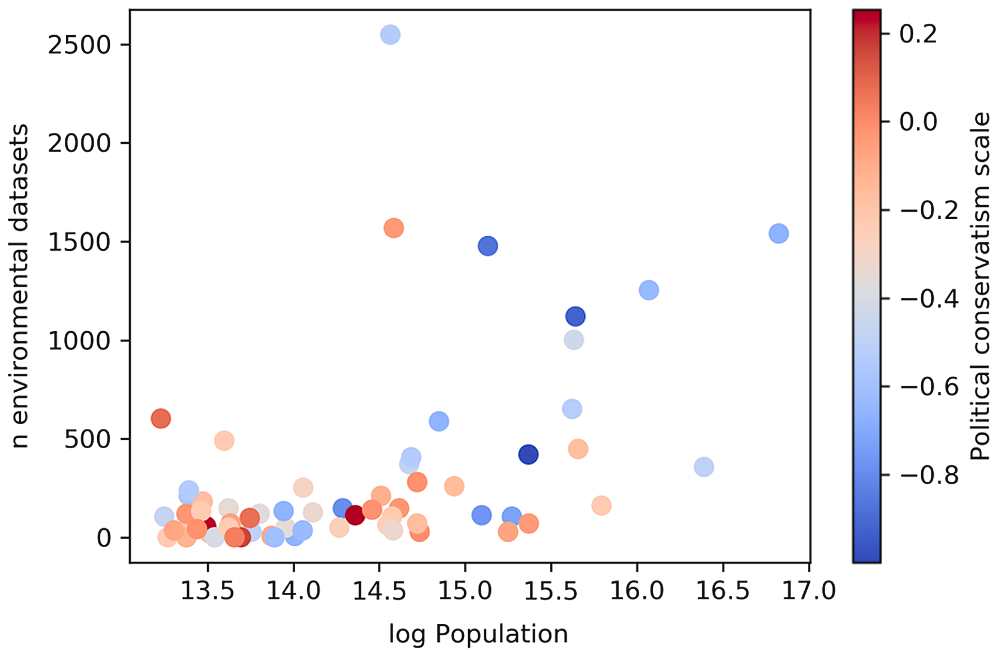
The scatterplot below highights the correlation between population (resources) and the number of environmental datasets, colored by political leaning.
## Critical Analysis & Conclusion
The study's most profound insight is that **financial resources alone do not dictate data availability.** While larger populations generally have more data, in states, a conservative leaning can negate the resource advantage when it comes to tracking "Environmental Performance."
### Limitations
* **Proxy Logic**: Using population as a proxy for financial resources is a simplification.
* **The "Cheap Data" Trap**: High volume doesn't always mean high priority; it might just mean that certain types of data (like automated sensor logs) are cheaper to store.
### Final Takeaway
For those advocating for climate action or environmental justice, this research highlights a critical "Data Gap." If we want to solve global environmental issues, we must first address the fact that our digital repositories are currentlly fragmented by local political boundaries and ideological silos.