
EPIC: Bridging Vital Signs and Social Graphs for Precision Epidemic Control
Epidemic Control Based on Fused Body Sensed and Social Network Information
This paper introduces EPIC, a novel epidemic control system that integrates real-time vital signs from Wireless Body Area Networks (WBAN) with social network topology. By modeling individuals and their interactions as a "critical network," the system predicts disease spread and optimizes quarantine strategies to minimize outbreaks.
TL;DR
Researchers have developed EPIC, an information system that transforms how we fight outbreaks. By combining real-time health data from body sensors with social interaction maps, EPIC can predict exactly who is likely to get sick and who should be quarantined to stop a pandemic in its tracks. In simulations, it effectively eliminated diseases while traditional random methods failed.
The Visibility Gap in Public Health
Current epidemic monitoring is largely reactive. Systems like Google Flu Trends or hospital-based tracking rely on people already being sick enough to seek care. This creates two major flaws:
- The Time Lag: By the time a case is confirmed, the individual has likely already infected dozens of others.
- The Social Blindspot: Standard models treat populations as homogeneous groups, ignoring the high-traffic "hubs" in social networks that act as super-spreaders.
EPIC seeks to solve this by creating a Critical Network—a live, digital twin of a community's health and social links.
Methodology: The Critical Network
The core innovation lies in the fusion of two data streams:
- Sensory Data: Mobile devices and WBANs (Wireless Body Area Networks) collect vital signs like heart rate and oxygen saturation to classify health states (Susceptible, Infected, or Recovered).
- Social Data: Proximity signals (e.g., Bluetooth/Acoustic) define the edges of the network, showing who interacts with whom.
The q-Influence Model
To quantify risk, EPIC uses the q-Influence model. The probability of a person becoming infected depends on their number of infected neighbors and the disease's transmission probability : This means the model doesn't just look at whether you are near a sick person, but calculates your cumulative risk based on your entire social circle.
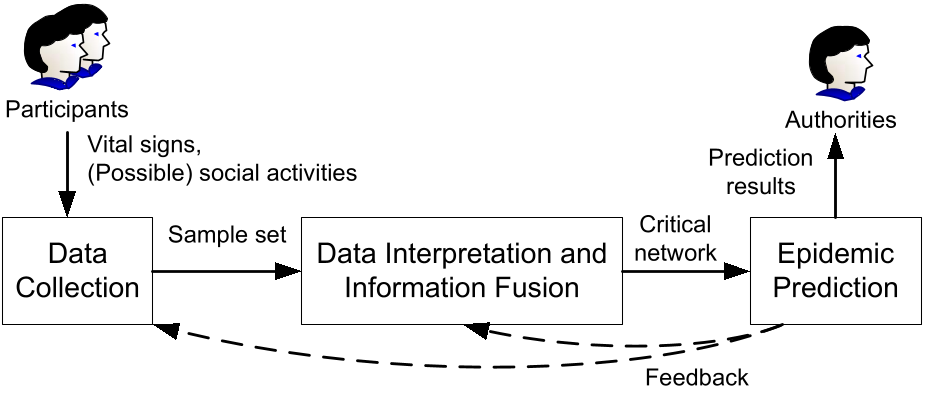 Figure 1: High-level workflow of EPIC involving data collection, fusion, and prediction.
Strategic Quarantine: Identifying the "Critical Set"
Standard lockdowns are economically devastating because they are "blind." EPIC introduces a Critical Quarantine Set Search. Since finding the absolute best people to isolate is an NP-complete problem (akin to the Set Cover problem), the authors developed a heuristic algorithm. It performs "What-If" tests: "If we isolate person X, how many people stay healthy 10 days from now?"
It then chooses the top individuals who provide the maximum "protection" for the rest of the network.
Experimental Results
The researchers tested EPIC against "Random Quarantine" and "No Control" strategies on a 500-node scale-free network (which mimics real-world human interaction patterns).
- Speed of Spread: In scenarios with no recovery, EPIC delayed the total infection of the population significantly longer than random methods.
- Disease Eradication: In a scenario where patients recover after 9 days, EPIC was the only method capable of completely extinguishing the virus (at time unit 15), whereas random quarantine merely "flattened the curve" without stopping the spread.
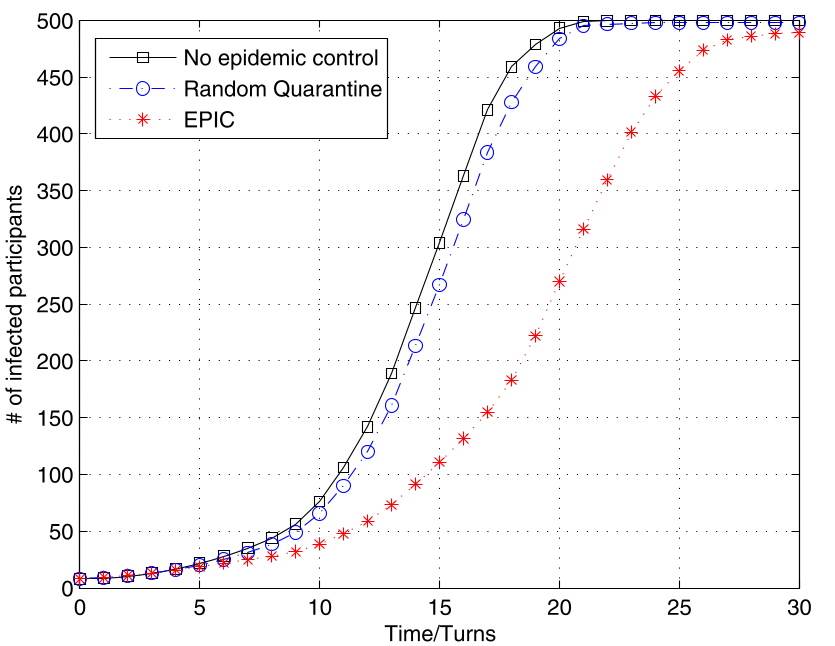 Figure 2: EPIC (removing 2 nodes) vs. Random Quarantine and No Control. Note how EPIC effectively suppresses the infection peak.
Handling the Real-World: Missing Data
A common critique of sensor-based systems is incomplete data (not everyone has a smartwatch). EPIC uses Local Majority Estimation (LME) to fill the gaps. If a person's status is unknown, the system looks at their neighbors. If the majority of neighbors are infected, the system conservatively treats the unknown node as a potential carrier. Simulation results showed that with LME, EPIC's accuracy remained nearly identical to scenarios with perfect data.
Critical Insight & Conclusion
EPIC shifts the paradigm of epidemic control from mass measures to surgical interventions. By identifying the specific edges in a social network that facilitate the most "flow" of a virus, health authorities can implement cost-effective strategies with minimal societal disruption.
While privacy concerns regarding social interaction tracking remain a significant hurdle for real-world deployment, the technical framework of EPIC provides a blueprint for how future IoT-enabled cities can defend themselves against the next global health crisis.