
Deciphering the Political Pulse: Estimating Leanings via Signed Graph-Signal Restoration
Estimating political leanings from mass media via graph-signal restoration with negative edges
This paper introduces a Graph Signal Processing (GSP) framework to estimate the political leanings of public figures by fusing multi-modal media data. It utilizes a novel generalized graph Laplacian to handle signed graphs (containing both positive and negative edges) for signal restoration, effectively classifying politicians as "left" or "right" and identifying outliers.
TL;DR
Researchers have developed a data-driven method to map political leanings by analyzing how politicians interact across Twitter and TV news. By treating political orientation as a "signal" on a graph and leveraging a novel Generalized Graph Laplacian, the framework can reliably predict party affiliations and—more importantly—detect "outlier" politicians who deviate from their party line.
Background: Beyond Simple Similarity
Most social network analysis assumes that "connections" imply "similarity." However, politics is defined by conflict. While sharing Twitter followers suggests a common audience (positive edge), appearing together in a balanced news segment often implies a head-to-head debate (negative edge).
Conventional Graph Signal Processing (GSP) tools struggle with these negative edges because they break the mathematical stability of the Graph Laplacian. This paper addresses this gap by defining a robust mathematical framework to handle "dissimilarity" edges.
Methodology: The Geometry of Opposition
The core innovation lies in how the authors handle the Graph Spectrum.
1. Graph Construction
The authors build a multi-modal graph:
- Positive Edges (): Derived from the Jaccard-like similarity of Twitter follower sets.
- Negative Edges (): Derived from co-appearances in a 12-year archive of NHK News (Japan). The intuition is rooted in "fairness" doctrines: news programs often pit two opposing views against each other.
2. Solving the Stability Problem
In a standard graph, the Laplacian is Positive Semi-Definite (PSD). When negative edges are added, can have negative eigenvalues, making the optimization problem "ill-posed" (the energy could go to negative infinity).
The authors propose the Generalized Graph Laplacian (): By shifting the entire spectrum by the value of the smallest eigenvalue, they ensure the matrix is PSD while preserving the eigenvectors. These eigenvectors are crucial because, in a signed graph, the "lowest frequency" component actually contains the zero-crossings that represent the ideological divide between parties.
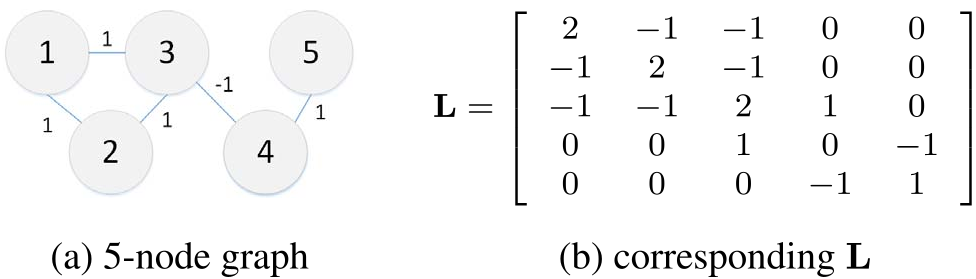 In the figure above, a negative edge between nodes 3 and 4 forces a "zero-crossing," accurately reflecting a signal flip between opposing entities.
Experimental Insights: Finding the "Shadow Shoguns"
The model was tested on both Japanese and US political datasets.
The Power of Negative Edges
In the Japanese dataset, using Twitter data alone resulted in 4 errors. Adding the "negative" TV news edges reduced this significantly.
- Outlier Detection: The model highlighted individuals like Ichiro Ozawa and Shizuka Kamei. Although officially belonging to a party, the model assigned them low-confidence scores or "flipped" them, reflecting their real-world history of forming coalitions against their own parties or defecting.
US Polarization
The US experiment (using governors and presidential candidates) showed that the graph structure is highly polarized.
- Charlie Baker (MA): The only "error" in the US set, Baker was predicted as leaning Democrat despite being a Republican. However, this "error" is actually a success in outlier detection, as Baker is a well-known moderate who publicly distanced himself from his party’s national platform.
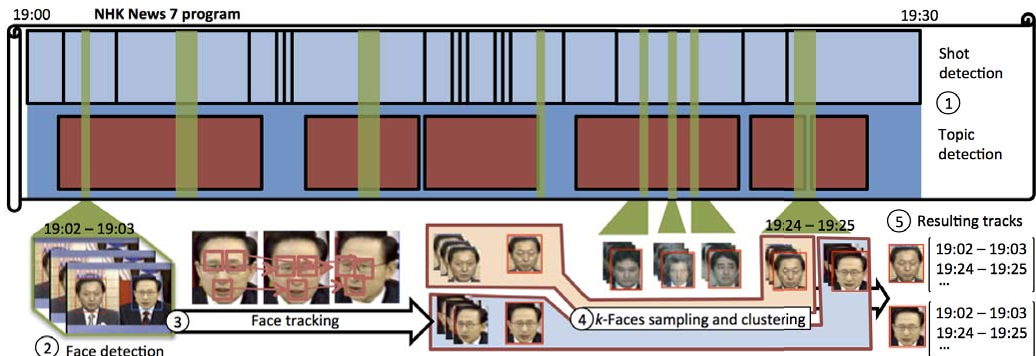 TV news segmentation provides the raw data for negative edge construction.
Critical Analysis & Conclusion
This paper effectively moves GSP from "smoothness" (everyone is the same) to "consistency" (differences are respected).
Takeaways:
- Signal Restoration vs. Classification: By treating political leaning as a continuous signal () rather than a binary label, we get a "spectrum" of leanings that identifies moderates and extremists.
- Stable Spectrum: The perturbation is a simple yet elegant solution to a fundamental instability in signed graph processing.
Limitations: The reliance on TV news co-appearance assumes a "balanced debate" format. In media landscapes where news is an "echo chamber" (e.g., talk shows where hosts only interview allies), the negative edge assumption might fail. Future work could benefit from incorporating NLP-based sentiment analysis to dynamically determine if a co-appearance is antagonistic or supportive.
Future Outlook: This methodology isn't limited to politics. It could be applied to brand competition, sports rivalries, or any domain where "adversarial similarity" exists.