
Decoding the Economy: A Semantic Path Model for News-Based Macroeconomic Forecasting
European journal of operational research
The paper introduces an innovative forecasting framework for macroeconomic indicators by integrating unstructured financial news (80,813 ad hoc announcements) into predictive models. The core contribution is a "Semantic Path Model" that utilizes latent semantic structures and regularization to deliver both high-accuracy long-term forecasts (up to 24 months) and human-interpretable results.
Executive Summary
TL;DR: This paper bridges the gap between unstructured big data and macroeconomic theory. By analyzing over 80,000 corporate announcements through a novel Semantic Path Model, the authors demonstrate that financial news can significantly outperform traditional time-series benchmarks in predicting key indicators like GDP and Unemployment, specifically for long-term horizons up to 2 years.
Academic Positioning: This work moves beyond simple sentiment analysis. It sits at the intersection of Operations Research (OR) and Natural Language Processing (NLP), transforming the "black-box" nature of machine learning into a transparent, regularized path model that decision-makers can actually trust.
Problem & Motivation: The "Static" Nature of Traditional Forecasting
Macroeconomic developments—like the 2008 crisis—have immediate impacts on raw material prices, supply chains, and financing. Yet, the tools used to predict these events are often:
- Backward-looking: Relying solely on historical lags (AR/ARMA models).
- Subjective: Dependent on expert judgments that can be biased.
- Dimensionally Challenged: Traditional stats struggle with the "High-dimensional data, Low-frequency observation" nature of quarterly GDP data.
The author's insight is that ad hoc announcements from listed companies act as a "canary in the coal mine." These disclosures contain qualitative indicators of firm health and expectations that numeric data simply doesn't capture yet.
Methodology: The Semantic Path Model
The core of the paper is the transition from raw word counts to Latent Semantic Structures.
1. Feature Engineering via Projections
Instead of letting a model find arbitrary patterns in words, the authors project words onto predefined semantic constructs:
- Positivity/Negativity (Economic outlook)
- Uncertainty (Risk perception)
- Modal Indicators (Confidence levels)
2. Regularized Path Modeling
To solve the "black-box" problem, they use a Semantic Path Model. Mathematically, it predicts as a linear combination of these latent constructs. To prevent overfitting (a major risk in macro data), they apply LASSO and Ridge regularization to the path coefficients.
 Note: The architecture combines time-series lags with high-dimensional textual features projected into a low-dimensional semantic space.
Experiments & Results
The authors tested their model against traditional Auto-Regressive (AR) benchmarks and standard Machine Learning (Random Forest, Gradient Boosting) across indicators like Eurozone GDP, Inflation, and Business Confidence.
Key Findings:
- Unemployment (h=24): Achieved a massive 32.7% error reduction compared to the AR benchmark.
- Eurozone GDP (h=1): Reduced RMSE by 23% using semantic features.
- Interpretability: The model allows managers to "see" why a forecast changed. For example, a spike in "Uncertainty" words in news filings directly maps to a predicted downturn in industrial production.
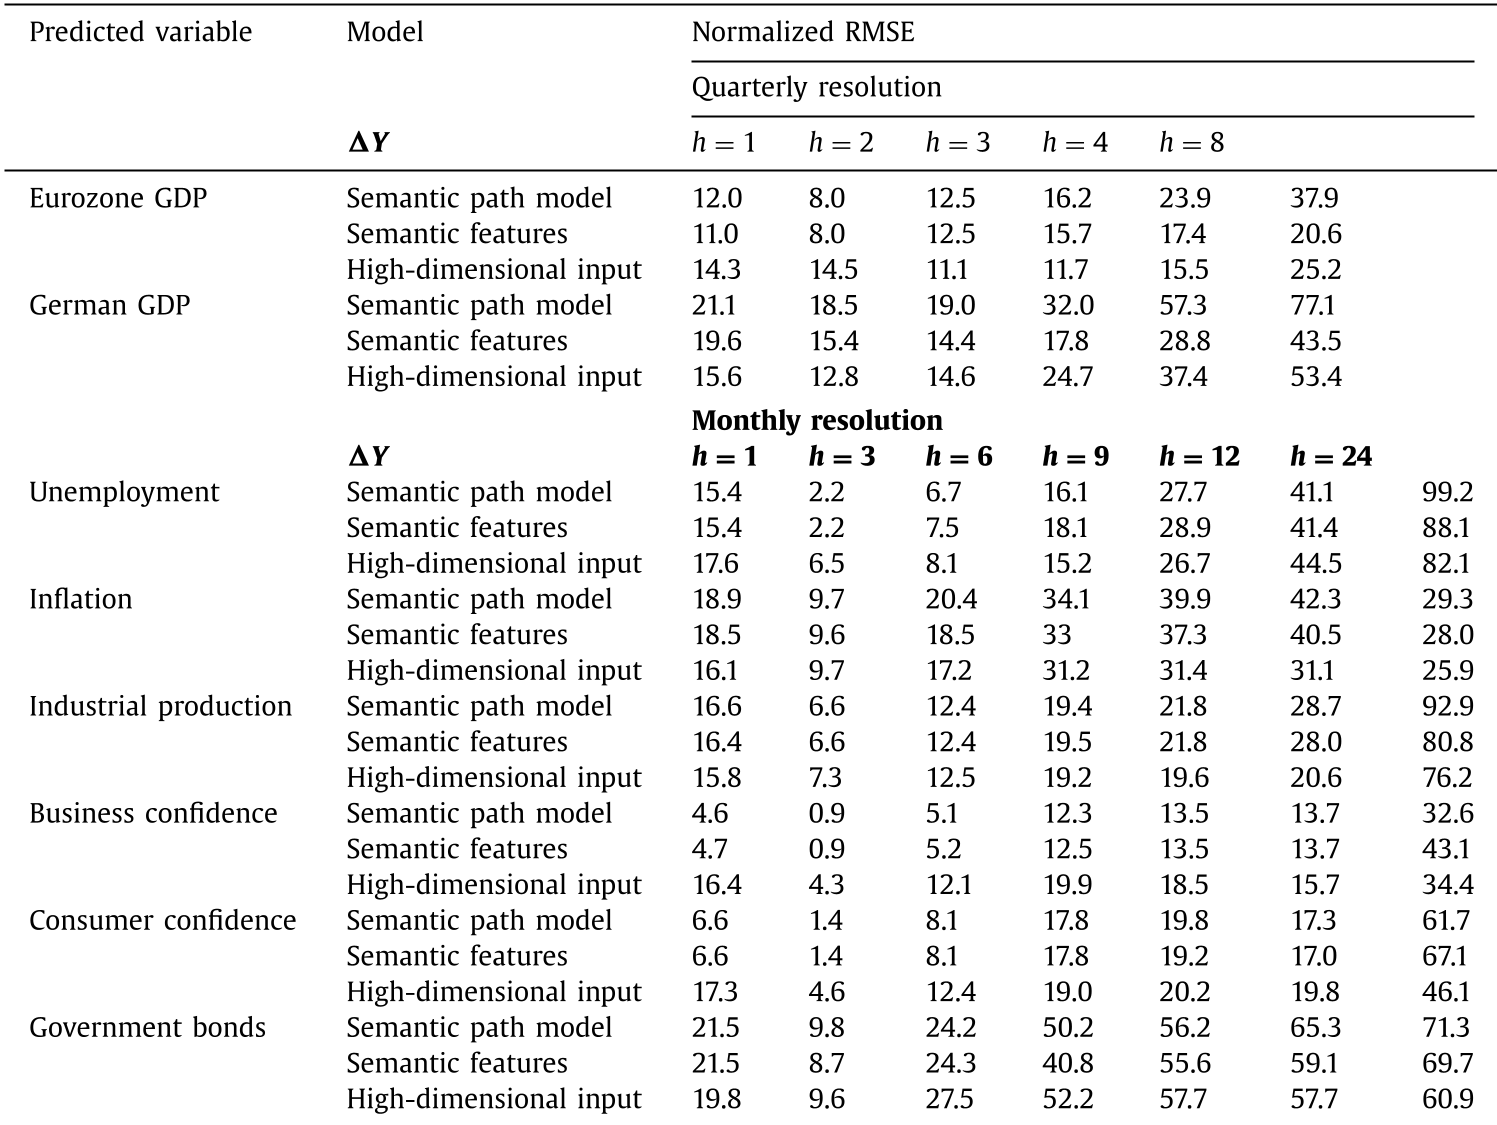 Table 5: Normalized RMSE showing the superiority of Semantic models in long-term monthly resolutions (h=24).
Deep Insight: Why Semantics Matter
The real breakthrough here isn't just "accuracy"—it's robustness. By forcing the model to operate through semantic "bottlenecks" (Constructs), the authors inject Inductive Bias based on economic theory. This prevents the model from picking up "spurious correlations" (e.g., a specific company name appearing frequently during a bull market) and instead focuses on the sentiment that drives behavior.
Visualizing Interpretability
The authors provide a powerful visualization of how different constructs (Uncertainty vs. Positivity) evolve over the test set, allowing users to decompose a 2016 GDP forecast into its underlying narrative drivers.
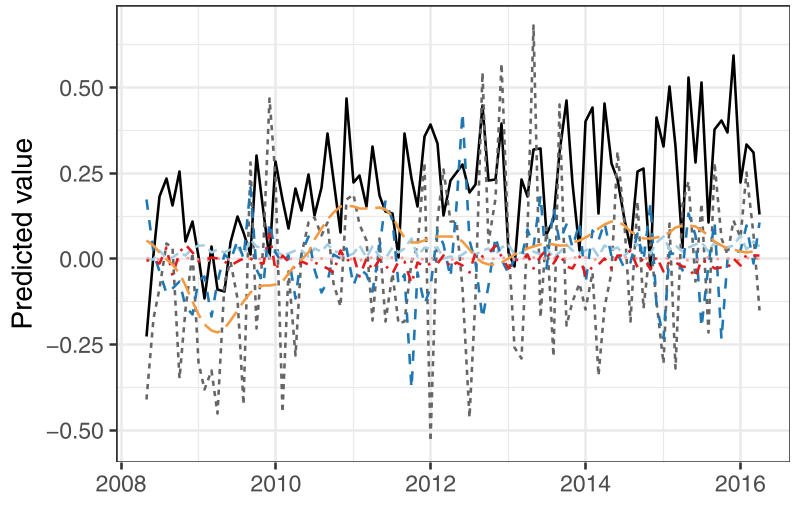 Fig 2: Latent structures plotted over time, showing how specific semantic categories (e.g., Legal, Risk) trend during different economic phases.
Conclusion & Future Outlook
This paper proves that qualitative narratives are quantitative predictors. For the public sector, this offers a cost-effective way to monitor fiscal health in real-time. For private firms, it provides a strategic hedge against macroeconomic volatility.
Future Work: The next frontier involves weighting news by market capitalization (since a 10% change in a giant like SAP impacts the German economy more than a small cap) and integrating modern Transformer-based embeddings into the same interpretable path framework.