
High-Fidelity Whole-System Patient Flow: Predicting the Ripple Effects of Healthcare Policy
European journal of operational research
This paper presents a high-fidelity system dynamics (SD) simulation model designed for whole-system patient flow modeling in Ontario, Canada. The methodology, validated through a stroke best practices implementation case study, provides a strategic decision-support tool to evaluate healthcare transformation policies across multiple sectors.
TL;DR
Researchers from the University of Toronto have developed a sophisticated System Dynamics (SD) model that simulates an entire provincial health system. Unlike previous "siloed" models, this work uses granular patient-level data to show how changing a single policy—such as stroke recovery protocols—creates a domino effect across acute, rehabilitative, and community care sectors.
Background: The "Whole-System" Challenge
Healthcare systems are notoriously complex ecosystems. Planners often face a "Whack-a-Mole" problem: reducing wait times in the Emergency Department might inadvertently clog up Rehabilitation beds, or speeding up hospital discharges might overwhelm home care services. This paper argues that for policy transformation to work, analysts need a Whole-System perspective to move beyond tactical "bed-counting" toward strategic flow management.
The Problem: The Invisible Bottlenecks
Most existing models fail because they don't account for feedback loops. For instance, if an acute care hospital cannot discharge a patient because the "downstream" long-term care home is full, that patient becomes "Alternate Level of Care" (ALC). They occupy an expensive hospital bed despite no longer needing acute treatment. Prior work often ignored these cross-sector interactions or lacked the clinical granularity to understand which specific patient types (e.g., ischemic vs. hemorrhagic stroke) were causing the drag.
Methodology: The Sector Archetype
The researchers built a modular simulation using a Care Sector Archetype. Every sector in the model (Acute, Rehab, CCC, Home Care) follows a similar mathematical structure but is parameterized by historical patient data.
Key Innovation: Clinical High-Fidelity
Most SD models use aggregate populations. This model breaks patients down into:
- Demographics: 6 age/sex cohorts.
- Clinical Conditions: Using Case Mix Groups (CMGs) and Rehabilitation Client Groups (RCGs).
- Flow Type: Unidirectional, Bidirectional, and Parallel flows.
 Figure 1: The interconnectivity of the health system sectors, highlighting the complexity of patient transitions.
The Engine Under the Hood
The model tracks "Stocks" (patients in beds) and "Flows" (admissions/discharges). Crucially, it models capacity as a constraint. If Home Care reaches its limit for "nursing hours," the admission rate effectively drops to zero, forcing patients to stay longer in hospitals—automatically simulating the ALC phenomenon.
Case Study: Stroke Best Practices (SBP)
The authors tested the model by simulating Ontario’s proposed Stroke Best Practices. The goals were aggressive:
- Reducing Acute LOS to 5–7 days.
- Diverting nearly all ischemic stroke patients directly to outpatient community rehabilitation.
Experimental Results
The simulation produced a startling revelation: While the policy successfully "clears" hospital beds, the success is entirely dependent on the Community Sector.
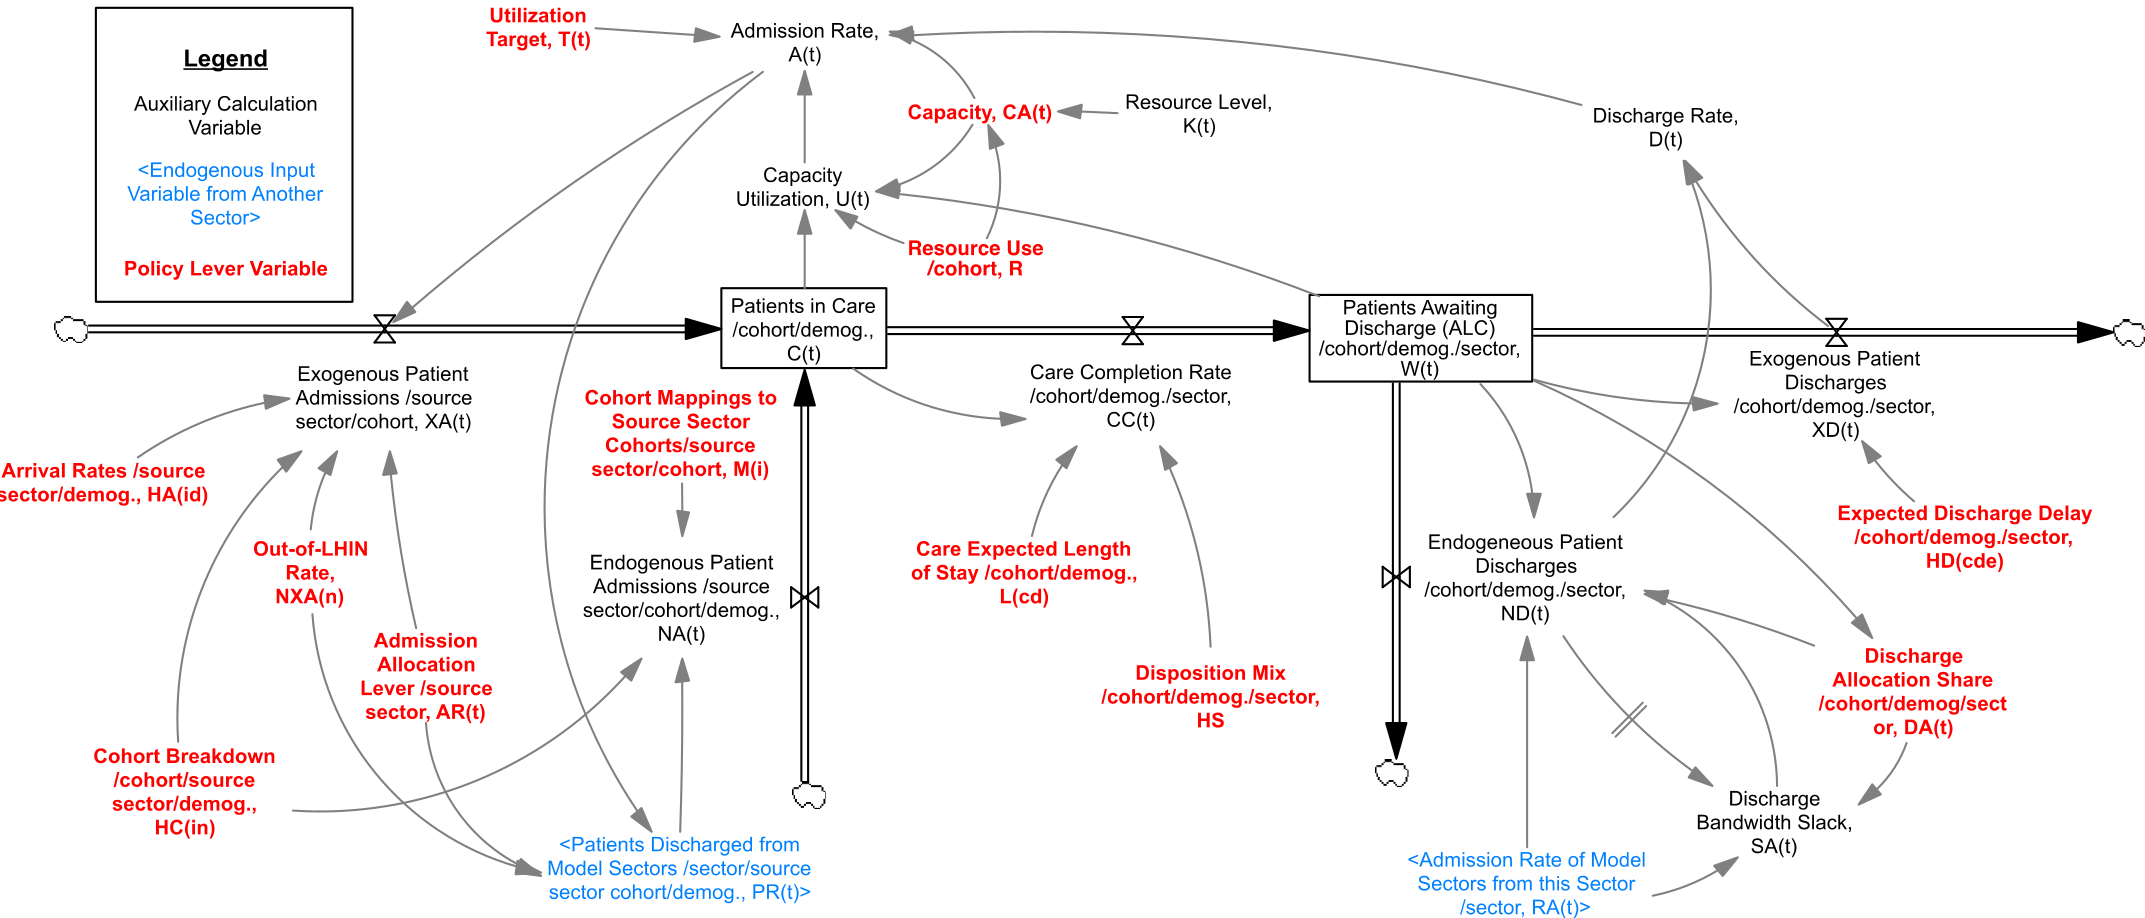 Figure 2: Detailed stock and flow diagram of the care sector archetype showing the ALC logic.
- Capacity Gain: The policy recovered 33.9 total beds per day across the LHIN (Local Health Integration Network).
- The Catch: To achieve this, community therapy enrollments had to increase by 145%. Without this investment, the hospital "savings" would never materialize because patients would simply have nowhere to go.
Critical Insight: Integration vs. Isolation
The most profound takeaway is shown in the policy's synergy. Improving only Length of Stay (clinical) or only diversion (structural) yielded minor results. However, when applied together, the system-wide gain was greater than the sum of its parts. This is the Feedback Loop in action: faster processing in acute care only works if the "exit door" to a high-capacity community sector is wide open.
Conclusion and Future Outlook
This work demonstrates that high-fidelity simulations are essentially "flight simulators" for healthcare policy. By using interactive dashboards, planners can test risky or expensive ideas in a virtual environment before committing millions in funding.
Limitations: The current model assumes static arrival rates and does not yet account for surgical waitlists or primary care (GPs). Future iterations will need to integrate "Informal Care" (family caregivers), which remains a massive, unquantified variable in the patient flow equation.