
Beyond Global Rankings: Decoding Group Dynamics in Job Satisfaction with Random Forests
Evaluating the impact of a grouping variable on Job Satisfaction drivers
This paper introduces an innovative algorithmic procedure to evaluate how grouping variables (e.g., sex, education) impact the importance of Job Satisfaction (JS) drivers. Using Random Forest (RF) variable importance measures as a foundation, the method identifies which factors influencing worker satisfaction fluctuate most across different demographic segments in the Italian Social Service sector.
TL;DR
How do you determine what makes workers happy when "happiness" means different things to different groups? While Random Forests (RF) are excellent at identifying general trends, this paper introduces a specialized algorithmic procedure to detect how demographic groups—like gender or education level—shift the importance of specific Job Satisfaction (JS) drivers. The study finds that while some motives are universal, others, like "professional consistency," vary wildly depending on who you ask.
The "Black Box" of Satisfaction
In the world of data mining, we often treat "Job Satisfaction" as a single target variable. We throw a dozen "facet" satisfactions (pay, hours, colleagues) into a model and see which one stick. Standard Random Forest models provide Variable Importance (VI) measures, telling us that, for instance, "Fulfillment" is more important than "Pay."
However, this global view hides a deeper truth: The drivers of satisfaction are not democratic. A male worker with a high-school diploma might value "Variety" differently than a female manager with a Master's degree. The problem? When you split data into these tiny subgroups, your model loses power. The author’s insight is to measure how much the entire model's stability shifts when a specific group is removed, exposing the "hidden" influence of that group on the drivers.
Methodology: The Leave-One-Group-Out (LOGO) Heuristic
The core of this work is an innovative two-stage procedure:
- Establishing "Natural Variability": Before assessing groups, the author runs the RF model multiple times on the full dataset to see how much the importance rankings wiggle just due to the random nature of the algorithm.
- The LOGO Procedure: The algorithm iteratively deletes one category of a grouping variable (e.g., all "Type A Cooperative" workers) and recalculates the importance measures. By comparing the variance (Coefficient of Variation) of these sessions to the "natural" baseline, we identify which variables are truly sensitive to grouping.
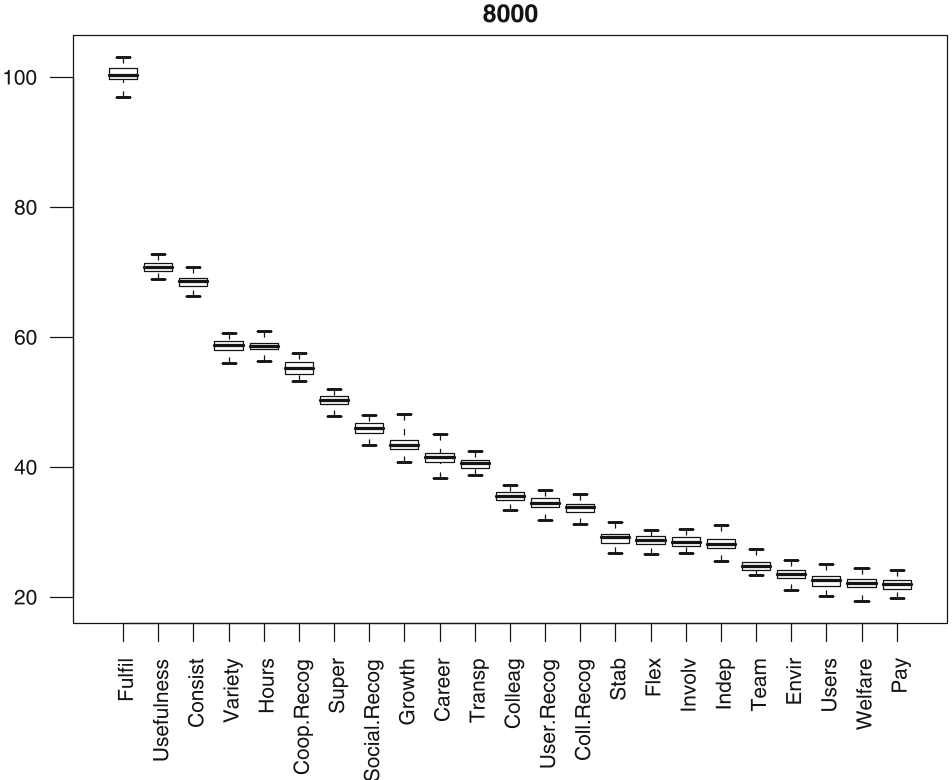 Above: The boxplots illustrate the stability of driver importance. While some drivers like "FULFIL" remain consistently at the top, their exact value shifts as the group composition changes.
Key Insights from the Social Service Sector
The study analyzed over 2,800 paid workers in Italian social cooperatives. The results challenge the traditional "one-size-fits-all" HR strategy:
- The Volatile Drivers: Factors like CONSIST (Consistence with education) and TRANSP (Transparency) showed the highest fluctuation (CV increases of +576% and +491% respectively). This means these drivers are critical for some groups but irrelevant for others.
- The Universal (Un)important: Interestingly, PAY and WELFARE were among the most stable—consistently ranking low across almost all groups. In the social service sector, it seems "doing good" outweighs "getting paid" regardless of who the worker is.
- The Fulfillment Gap: As seen in the visualizations below, higher-educated females placed a significantly higher premium on "Personal Fulfillment" compared to their male counterparts in similar roles.
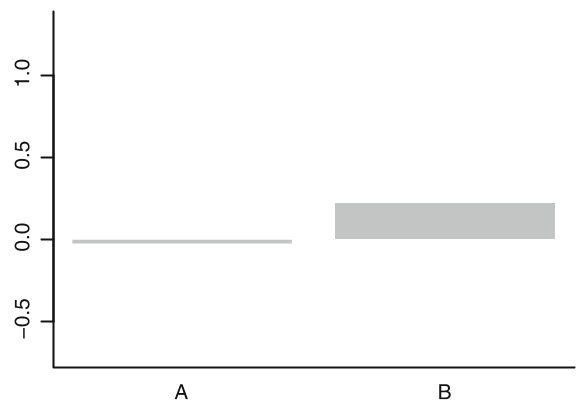 Visualizing the fluctuation of the "FULFIL" driver across 14 macrogroups.
Critical Analysis & Future Outlook
The beauty of this approach is its robustness. By using the Coefficient of Variation (), the author normalizes the importance scores, ensuring that low-ranking variables don't produce "noisy" results.
Limitations: The procedure is computationally expensive, requiring hundreds of Random Forest runs. Furthermore, while it tells us that a group matters, it doesn't always explain the direction of the impact without deeper manual clustering (as seen in Section 5.3).
Future Work: The logical next step involves integrating this procedure with SHAP (SHapley Additive exPlanations) or other local interpretability tools to see if we can automate the "Why" behind group-driven importance shifts.
Conclusion
For HR professionals and researchers alike, the takeaway is clear: Averages lie. If you want to improve job satisfaction, you must look at the variance between your teams. The LOGO procedure offers a mathematically rigorous way to find where those differences live.