
PhysiOBS: Bridging the Gap Between Physiology and User Emotional Experience
Evaluating User’s Emotional Experience in HCI: The PhysiOBS Approach
This paper introduces PhysiOBS, an innovative tool-based approach for evaluating User Emotional Experience (UEX) in Human-Computer Interaction. The system integrates physiological signals (HR, GSR, etc.), screen/face recordings, and self-reported data into a unified post-study analysis platform to identify both subtle and intense emotional states.
TL;DR
While we can measure how fast a user completes a task, we often fail to measure how they felt doing it. PhysiOBS is a new software framework that synchronizes physiological signals (like heart rate and skin conductance) with video recordings and self-reports. By providing a unified timeline for post-study analysis, it allows UX practitioners to pinpoint exactly where users experience frustration, anxiety, or joy, moving beyond simple task-completion metrics to a holistic understanding of User Emotional Experience (UEX).
The "Why": Beyond Task Success Rates
The maturity of current technology hasn't eliminated user frustration. Traditional HCI evaluation is built on the pillars of effectiveness and efficiency. However, these metrics are "thin slices" of the actual experience. A user might complete a task on a poorly designed website (High Effectiveness) but feel extreme irritation throughout the process (Low UEX).
Existing attempts to solve this via physiological monitoring have historically suffered from two major flaws:
- Intensity Bias: Most datasets focus on "high-arousal" events like gaming or watching horror movies. In typical office work, emotions are subtle and harder to detect.
- Lack of Context: A high heart rate could mean excitement or fear. Without seeing the screen or hearing the user's comments, the data is ambiguous.
Methodology: The PhysiOBS Architecture
PhysiOBS addresses these flaws by adopting a Multi-View Synchronization strategy. It is built on the "Two-Factor Theory of Emotion," which posits that physical reactions must be interpreted alongside the specific situation the person is facing.
1. Unified Interface
The tool provides four simultaneous views for the evaluator:
- User Video/Screen Capture: Including eye-tracking overlays to see exactly what the user was looking at.
- Physiological Stream: Normalized data for Heart Rate (HR), Blood Volume Pressure (BVP), and Galvanic Skin Response (GSR).
- Self-Reported Data: Qualitative feedback from the user.
- Emotional Timeline: A color-coded bar representing identified emotional states (e.g., Red for Anger, Coral for Anxiety).
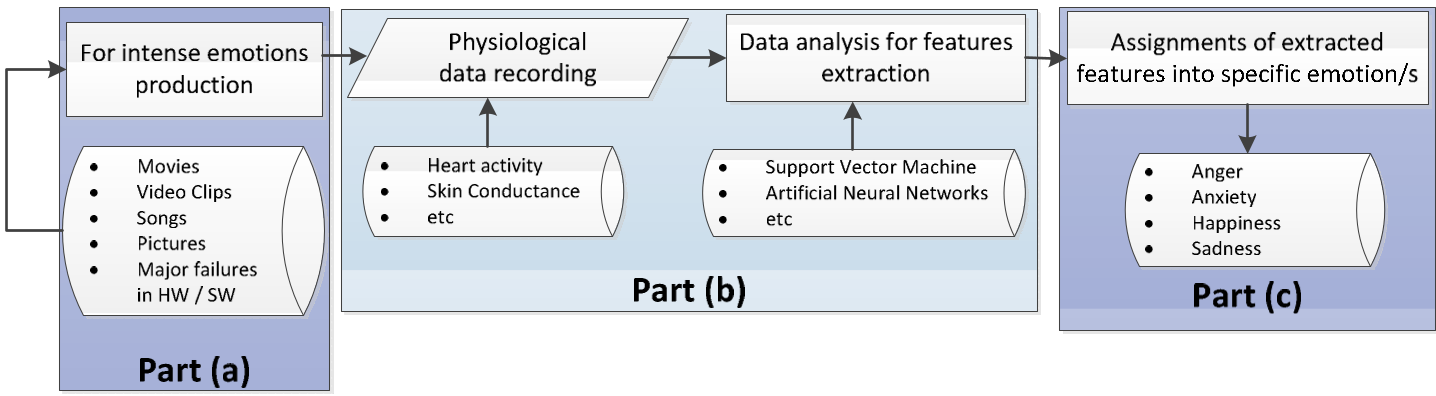 Figure 1: Conceptual overview of emotional recognition in HCI.
2. Semiautomatic Processing
The software doesn't just display raw data; it includes signal normalization and statistical analysis to highlight "areas of emotional interest." This assists the practitioner in finding the "needle in the haystack"—that specific moment where a subtle spike in skin conductance aligns with a user's frown on the video.
Experimental Results & Practitioner Feedback
The developers conducted a preliminary study with five HCI experts and two practitioners. The goal was to see if this "data-heavy" approach was actually usable in the real world.
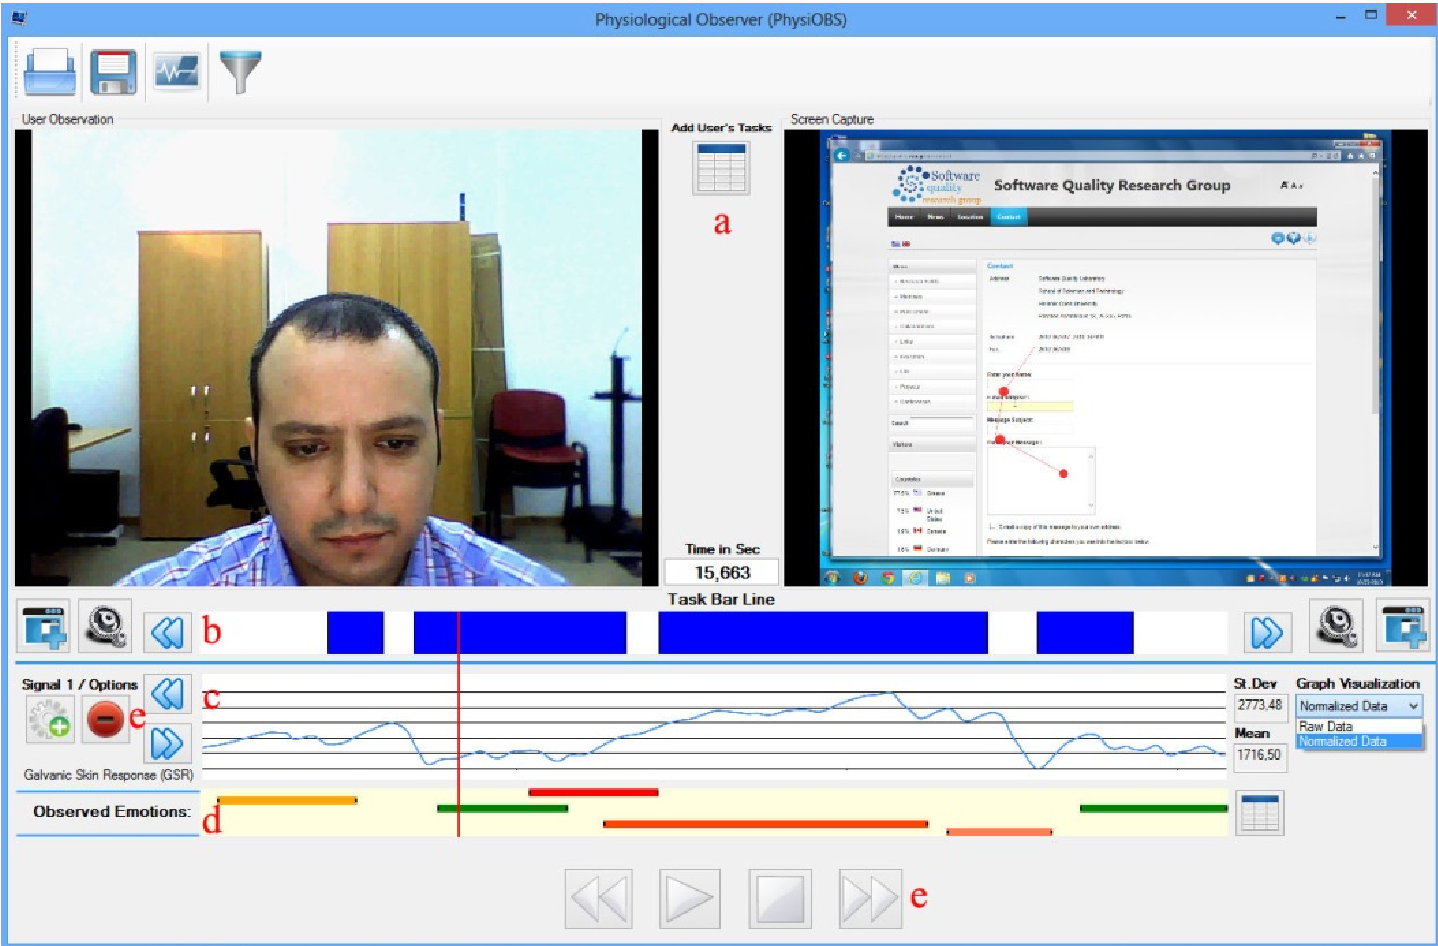 Figure 2: The PhysiOBS post-analysis interface showing synchronized video and physiological streams.
Key Findings:
- Efficiency: Experts found that having all data synchronized in one tool decreased the time and cognitive effort required for qualitative analysis.
- Depth of Insight: Practitioners confirmed that the "triangulation" of data (e.g., seeing a physiological spike followed by a specific screen action) allowed for a much deeper understanding of why a user was struggling.
- Subjectivity Reduction: By matching physiological "objective" data with "subjective" self-reports, the evaluation becomes more rigorous.
Critical Analysis & Future Outlook
PhysiOBS represents a significant step toward making Affective Computing accessible to UX practitioners who aren't necessarily data scientists. However, the current iteration relies heavily on manual labeling by the evaluator.
Limitations:
- Hardware Barriers: Physiological sensors can still be obtrusive and prone to noise (room temperature, user movement).
- Manual Effort: While the tool synchronizes data, a human still has to interpret and label the emotions.
The Future: The authors aim to introduce more automation through machine learning, using the emotionally labeled datasets generated by PhysiOBS to train models that can automatically suggest emotional states in real-time. This could eventually lead to "Emotion-Aware Interfaces" that adapt their layout or provide help the moment they detect a user's rising frustration.
Conclusion
In an era where "User Experience" is the primary competitive advantage, PhysiOBS provides the technical bridge needed to turn physiological signals into actionable design insights. It proves that the future of HCI isn't just about faster interactions, but about more empathetic ones.