
CODA: Decoding Student Collaboration through Graph Mining and Social Network Analysis
Evaluation of student collaboration on canvas LMS using educational data mining techniques
This paper presents CODA (Canvas Online Discussion Analyzer), a web-based prototype designed to automate the evaluation of student collaboration in CS1 courses. By integrating Social Network Analysis (SNA) and Educational Data Mining (EDM), the tool quantifies engagement and academic performance through discussion forum interactions on the Canvas LMS.
TL;DR
The manual grading of online discussion forums is a bottleneck for modern educators. CODA (Canvas Online Discussion Analyzer) is a data-driven prototype that transforms raw Canvas LMS data into a social graph. By applying Social Network Analysis (SNA) and keyword extraction, it automatically grades students based on their influence, leadership, and content relevance, significantly reducing instructor workload while improving pedagogical insights.
Problem: The "Black Box" of Online Discussions
While discussion forums are staples of digital learning, they often remain a "black box." Instructors struggle to answer:
- Who is truly facilitating the conversation vs. just posting for credit?
- Which course topics are causing the most frustration (negative sentiment)?
- How does a student's social position in the class network correlate with their final grade?
Traditional LMS tools offer limited analytics, forcing instructors to read every thread manually—a task that is virtually impossible in large-scale courses.
Methodology: From Threads to Graphs
The researchers treat student interactions not as linear text, but as a dynamic Interaction Network.
1. The Tech Stack
CODA extracts data via the Canvas REST API and stores it in Neo4j (managed by GrapheneDB). This allows the system to treat students as nodes and their interactions as weighted edges.
2. Message Classification
Using a Naive Bayes classifier, CODA categorizes posts into:
- Questions: Seeking information.
- Comments: General feedback.
- Discusses: Active content engagement.
3. Quantitative Evaluation (The 6 Metrics)
The heart of CODA lies in its grading engine, which uses graph theory to quantify social behavior:
- Degree Centrality: General activeness.
- Betweenness: How much a student acts as a "bridge" between different peer groups (Facilitation).
- Closeness: Proximity to others (Leadership).
- Clustering Coefficient: How well-connected a student is within their immediate circle.
- Keyword Validity (RAKE Algorithm): Measuring the information density of the post.
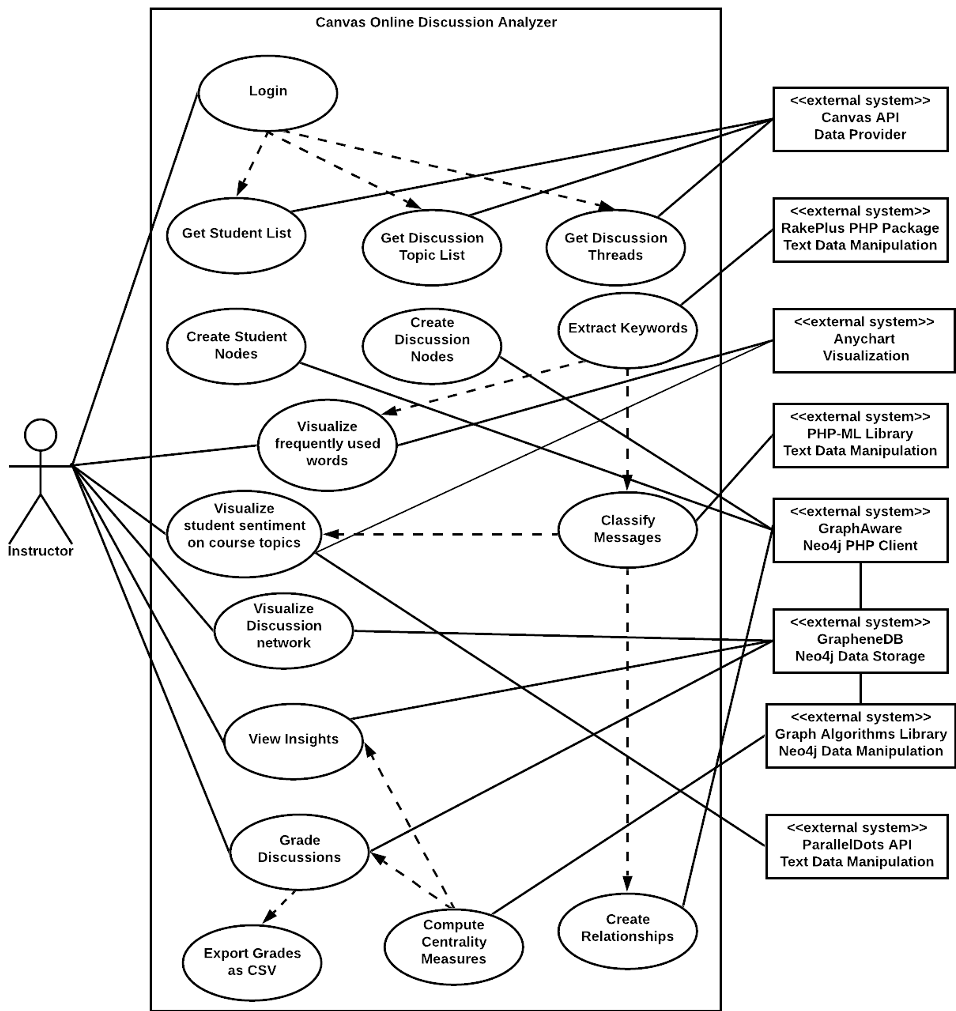 Figure: The System Architecture utilizing Neo4j and PHP-ML for data processing.
Experiments & Pedagogical Insights
The system was tested on a CS1 course with 102 students. The results revealed several "aha!" moments for educators:
Sentiment on Syllabus Topics
By mapping sentiment analysis to specific curriculum keywords, instructors could see a "heat map" of student struggle. If "Loops" or "Arrays" showed high negative sentiment, the instructor knew where to focus their next lecture.
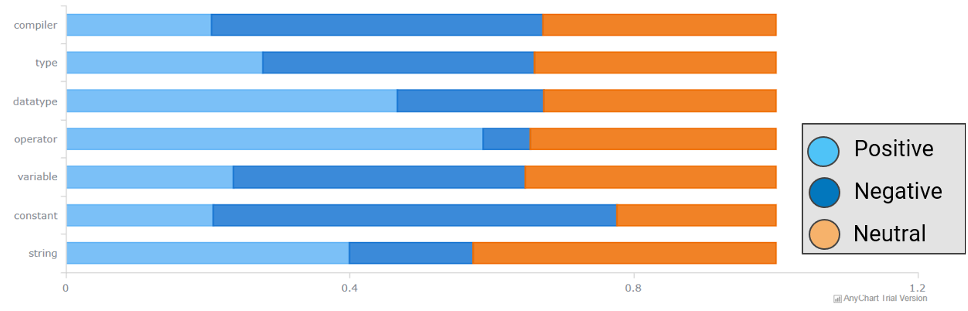 Figure: Stacked bar chart showing positive, negative, and neutral sentiments across syllabus topics.
Visualizing the "Hall of Fame"
CODA generates a "Hall of Fame" (Figure 9 in the paper) that highlights the "Friendliest Student" (Highest Betweenness) and the "Most Verbose" (Most Keywords). This provides a multi-dimensional view of student performance that a simple test score can't capture.
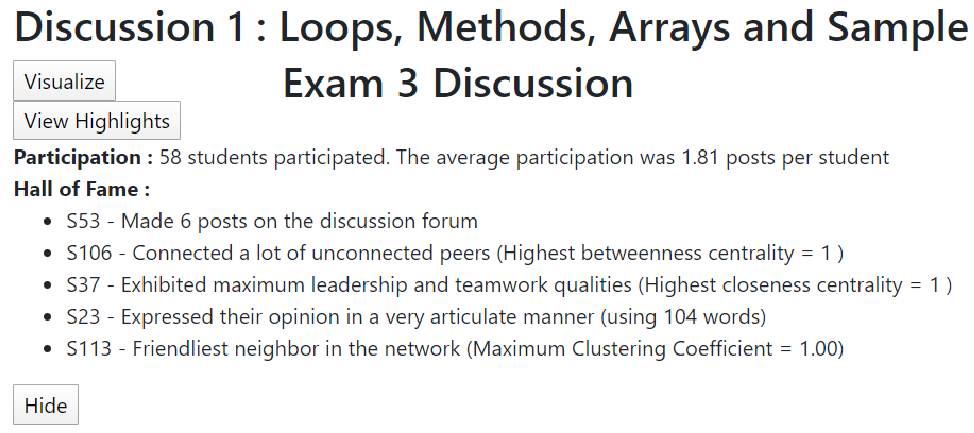 Figure: The CODA dashboard highlighting central actors in the discussion network.
Critical Analysis & Future Outlook
Value Add: The primary value of this work is the normalization of social metrics. By converting graph centralities into a 0-1 scale for grading, it provides a mathematically rigorous way to reward students who contribute to the "social capital" of the classroom.
Limitations:
- The Recency Bias: The paper notes that students often reply only to the latest posts in a linear thread, which can skew the graph toward "temporal luck" rather than intellectual engagement.
- Relevance Assumption: While keyword extraction helps, a high degree of "participation" might still include low-quality "I agree" posts that aren't fully filtered by current SNA metrics.
Conclusion: CODA is a significant step toward Automated Pedagogy. In an era of remote learning and massive online courses, tools that can "read" the social pulse of a class using graph theory are no longer a luxury—they are a necessity for scalable, quality education.