
Evolving Social Network Analysis: Decoding Human Dynamics via Mobile Data
Evolving social network analysis: A case study on mobile phone data
The paper presents a framework for Evolving Social Network Analysis (ESNA) using mobile phone call records. It introduces novel quantification measures for network evolution, individual significance, and social bonding, combined with an online "eClustering" approach to identify behavioral patterns. The method successfully tracked structural shifts in the VAST 2008 challenge dataset with high computational efficiency (under 3ms per call).
TL;DR
This research tackles the challenge of analyzing "living" social networks—those that change over time. By introducing a suite of novel metrics—Evolution-Index, Significance-Factor, and Social-Bonding—and pairing them with a real-time eClustering algorithm, the authors demonstrate a way to detect major events and identify key players in mobile communication logs with high precision and low computational cost.
Background Positioning: This work bridges the gap between traditional static graph theory and modern dynamic stream mining. It is an influential case study that moves beyond "Who is important?" to "When and why did the network structure change?"
Problem & Motivation: The Static Graph Fallacy
Most established Social Network Analysis (SNA) methods treat a network as a frozen snapshot. However, human relationships are inherently fluid. In mobile datasets, people enter and leave the network daily, and their "close circles" shift based on events (e.g., a crisis, a move, or a social gathering).
The authors argue that a major shift in a network is usually a response to a specific event. Prior works often focused on community merging/splitting, but these methods are often too heavy for real-time applications. The authors' intuition was to create a "timeline" by quantifying the stability of nodes and their local neighborhoods simultaneously.
Methodology: The Core Framework
The methodology is divided into three logical layers:
1. Tracking Temporal Evolution
Instead of just looking at whether a person (node) is present, the Evolution-Index (EI) looks at the "Stable Nodes" and asks: Did their immediate friends change? If a node is present on both Day 1 and Day 2, but its top 5 contacts are entirely different, the EI will spike, signaling a structural evolution.
2. Identifying Significance-Factors
The authors refined the standard "Degree Centrality." For mobile data, a "Key Individual" isn't just someone who makes many calls. They introduced:
- In-degree vs. Out-degree: Receiving more calls than you make often indicates higher social "significance."
- Appearance Count (AC): A user who makes 10 calls on one day is less significant than a user who makes 1 call every day for 10 days.
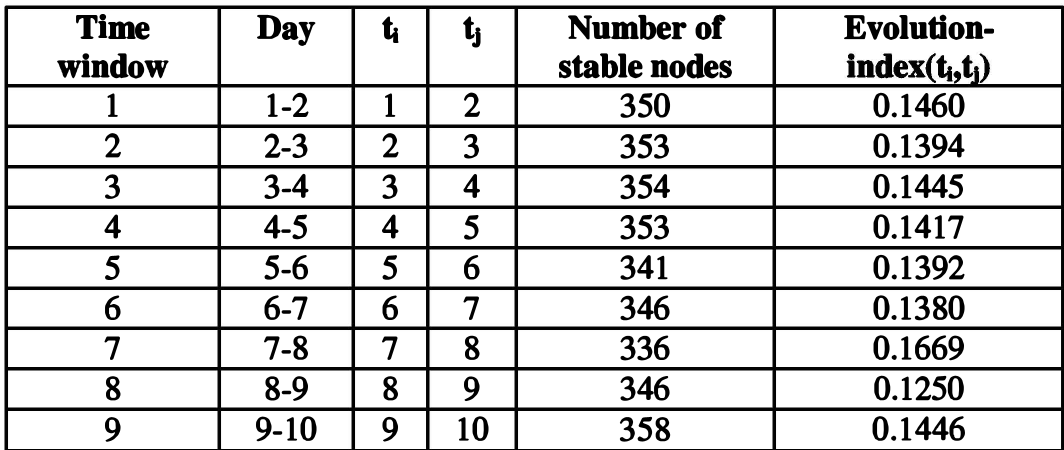 Table 1: Tracking the Evolution-Index across a 10-day window.
3. eClustering: Identifying Similar Behavioral Patterns
To group people with similar habits (e.g., night-owls who call from a specific city sector), the paper uses eClustering. Unlike K-Means, you don't need to tell it how many groups to find. It "evolves" the clusters as data arrives, making it perfect for streaming telecom data.
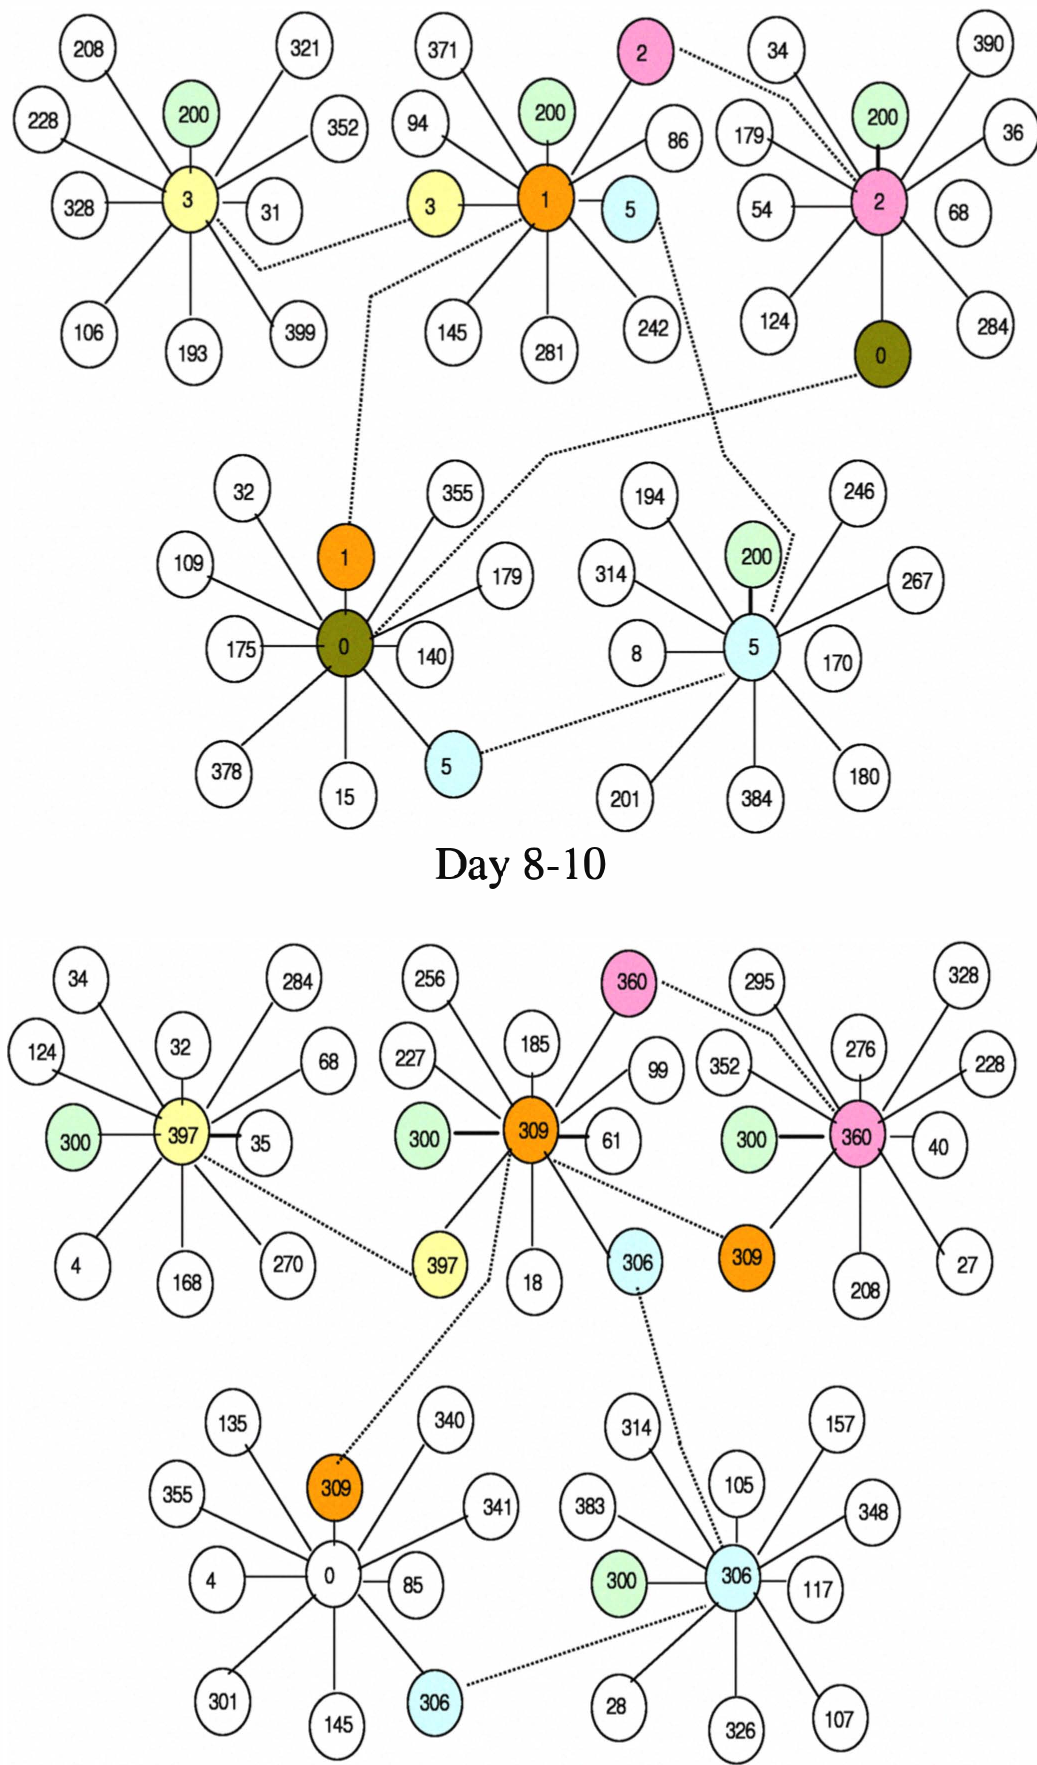 Figure 3: Visualization of the social bonding between key individuals and their immediate associates.
Experiments & Results: Validating the Event Timeline
Using the VAST 2008 Challenge dataset (containing ~10,000 call records), the framework was put to the test:
- The Day 7 Shift: The Evolution-Index correctly identified a massive structural change between Day 7 and Day 8, which matched the known ground truth.
- Key Player Detection: The significance-factor successfully identified the "catalyst" individuals (e.g., Ids 1, 2, 5) without any prior information.
- Efficiency: The whole process required less than 3 milliseconds per call, proving its suitability for live monitoring systems.
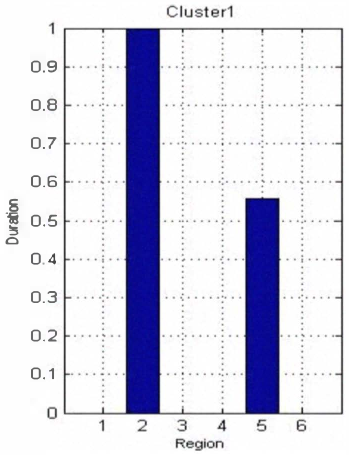 Figure 4: eClustering results showing three distinct behavioral profiles based on call hours and locations.
Critical Analysis & Conclusion
Takeaway: This paper provides a robust mathematical foundation for "Event-Driven Analysis." By quantifying the bonding and evolution rather than just the presence, it offers a more nuanced view of social dynamics.
Limitations:
- Immediate Ties Only: The current model only looks at direct connections (1-hop neighbors). In many social scenarios, indirect "friends-of-friends" (2-hop) are crucial for influence.
- Binary Evolution: The Evolution-Index treats all connection changes with equal weight, whereas a change in a frequent contact should likely matter more than a change in a one-time caller.
Future Outlook: The integration of spatio-temporal clustering with graph centrality is a precursor to modern Graph Stream Mining. Future work could likely integrate Deep Graph Kernels to automate the feature extraction process that the authors did manually here.