
Global Stock Market Strategies: Leveraging Financial Network Indicators and Machine Learning
Expert Systems With Applications
This study develops a global stock market investment strategy by integrating financial network indicators with machine learning models (LR, SVM, RF). It specifically utilizes undirected Pearson correlation and directed VAR-based connectivity measures to predict market directions and regional allocations between developed and emerging markets.
TL;DR
Predicting global stock movement is notoriously difficult due to the "Butterfly Effect" of interconnected economies. This paper moves beyond simple price analysis by constructing Financial Volatility Networks. By combining these network "connectedness" signals with Machine Learning (SVM, Random Forest), the authors achieved a significant boost in prediction accuracy and portfolio returns, particularly during economic crises.
Background: Why Networks Matter
In an era of globalization, no stock market is an island. A tremor in the S&P 500 can trigger a landslide in emerging markets. Traditional quantitative strategies often focus on internal factors (like a country's P/E ratio), but they miss the external structural risks—the hidden wires connecting global exchanges. This study treats the global market as a living graph, where nodes are countries and edges are the transmission lines of volatility.
Methodology: Mapping the Invisible Web
The research team selected 10 representative indices (5 Developed, 5 Emerging) and employed two distinct types of networks:
- Undirected Networks (Pearson Correlation): To capture the general co-movement density between countries.
- Directed Networks (VAR Model): Utilizing Vector Auto-Regressive variance decomposition to identify the direction and strength of volatility spillovers (e.g., how much of Germany's volatility is "exported" to the UK).
The Analytical Pipeline
The authors didn't just look at raw data; they used a rolling window approach and converted network density into Z-scores (normalized against a 52-week history). These features were then fed into three ML models: Logistic Regression (LR), Random Forest (RF), and Support Vector Machines (SVM).

Key Insights from the Networks
The "Connectedness Measure" acts as a barometer for global systemic risk. As seen in the figure below, the network density spikes dramatically during periods of crisis (e.g., the 2008 Global Financial Crisis).
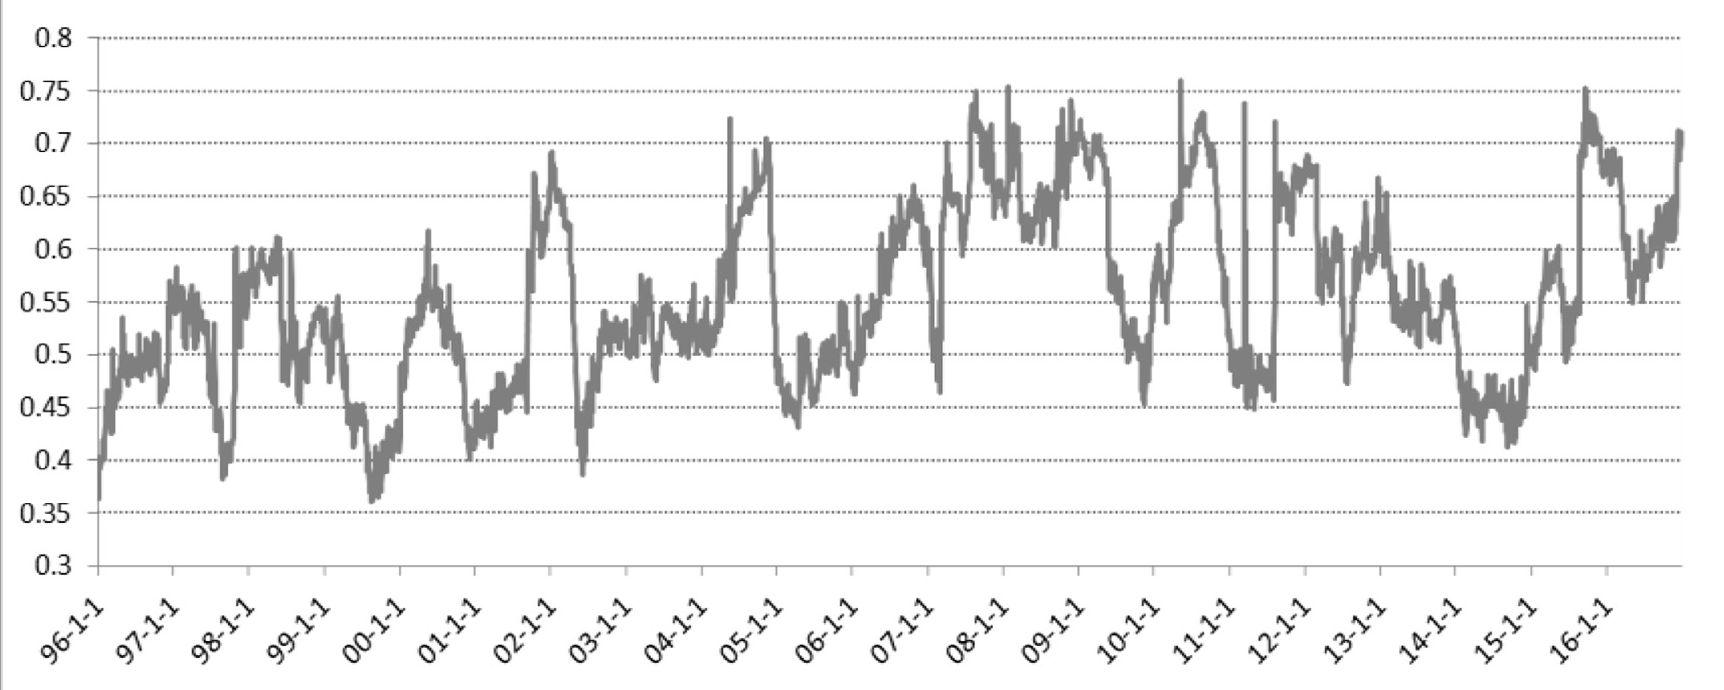
- Crisis Effectiveness: Network indicators are most powerful when the market is "noisy" or crashing.
- Horizon Matters: These indicators are better for mid-term (8-12 weeks) forecasting than short-term (1 week) trading, suggesting that network structures influence market regimes over months rather than days.
Experimental Battle: ML with vs. without Networks
The results were clear: adding network attributes consistently outperformed models using only historical price data.
| Machine Model | With Network (12w) | Without Network (12w) | Improvement |
|---|---|---|---|
| SVM | 71.5% | 70.5% | +1.0% |
| LR | 65.8% | 64.2% | +1.6% |
| RF | 66.2% | 63.0% | +3.2% |
While a 2-3% increase in accuracy might seem modest to a layman, in the world of institutional asset management, it represents a massive edge in risk-adjusted returns (Sharpe ratio) and alpha generation.
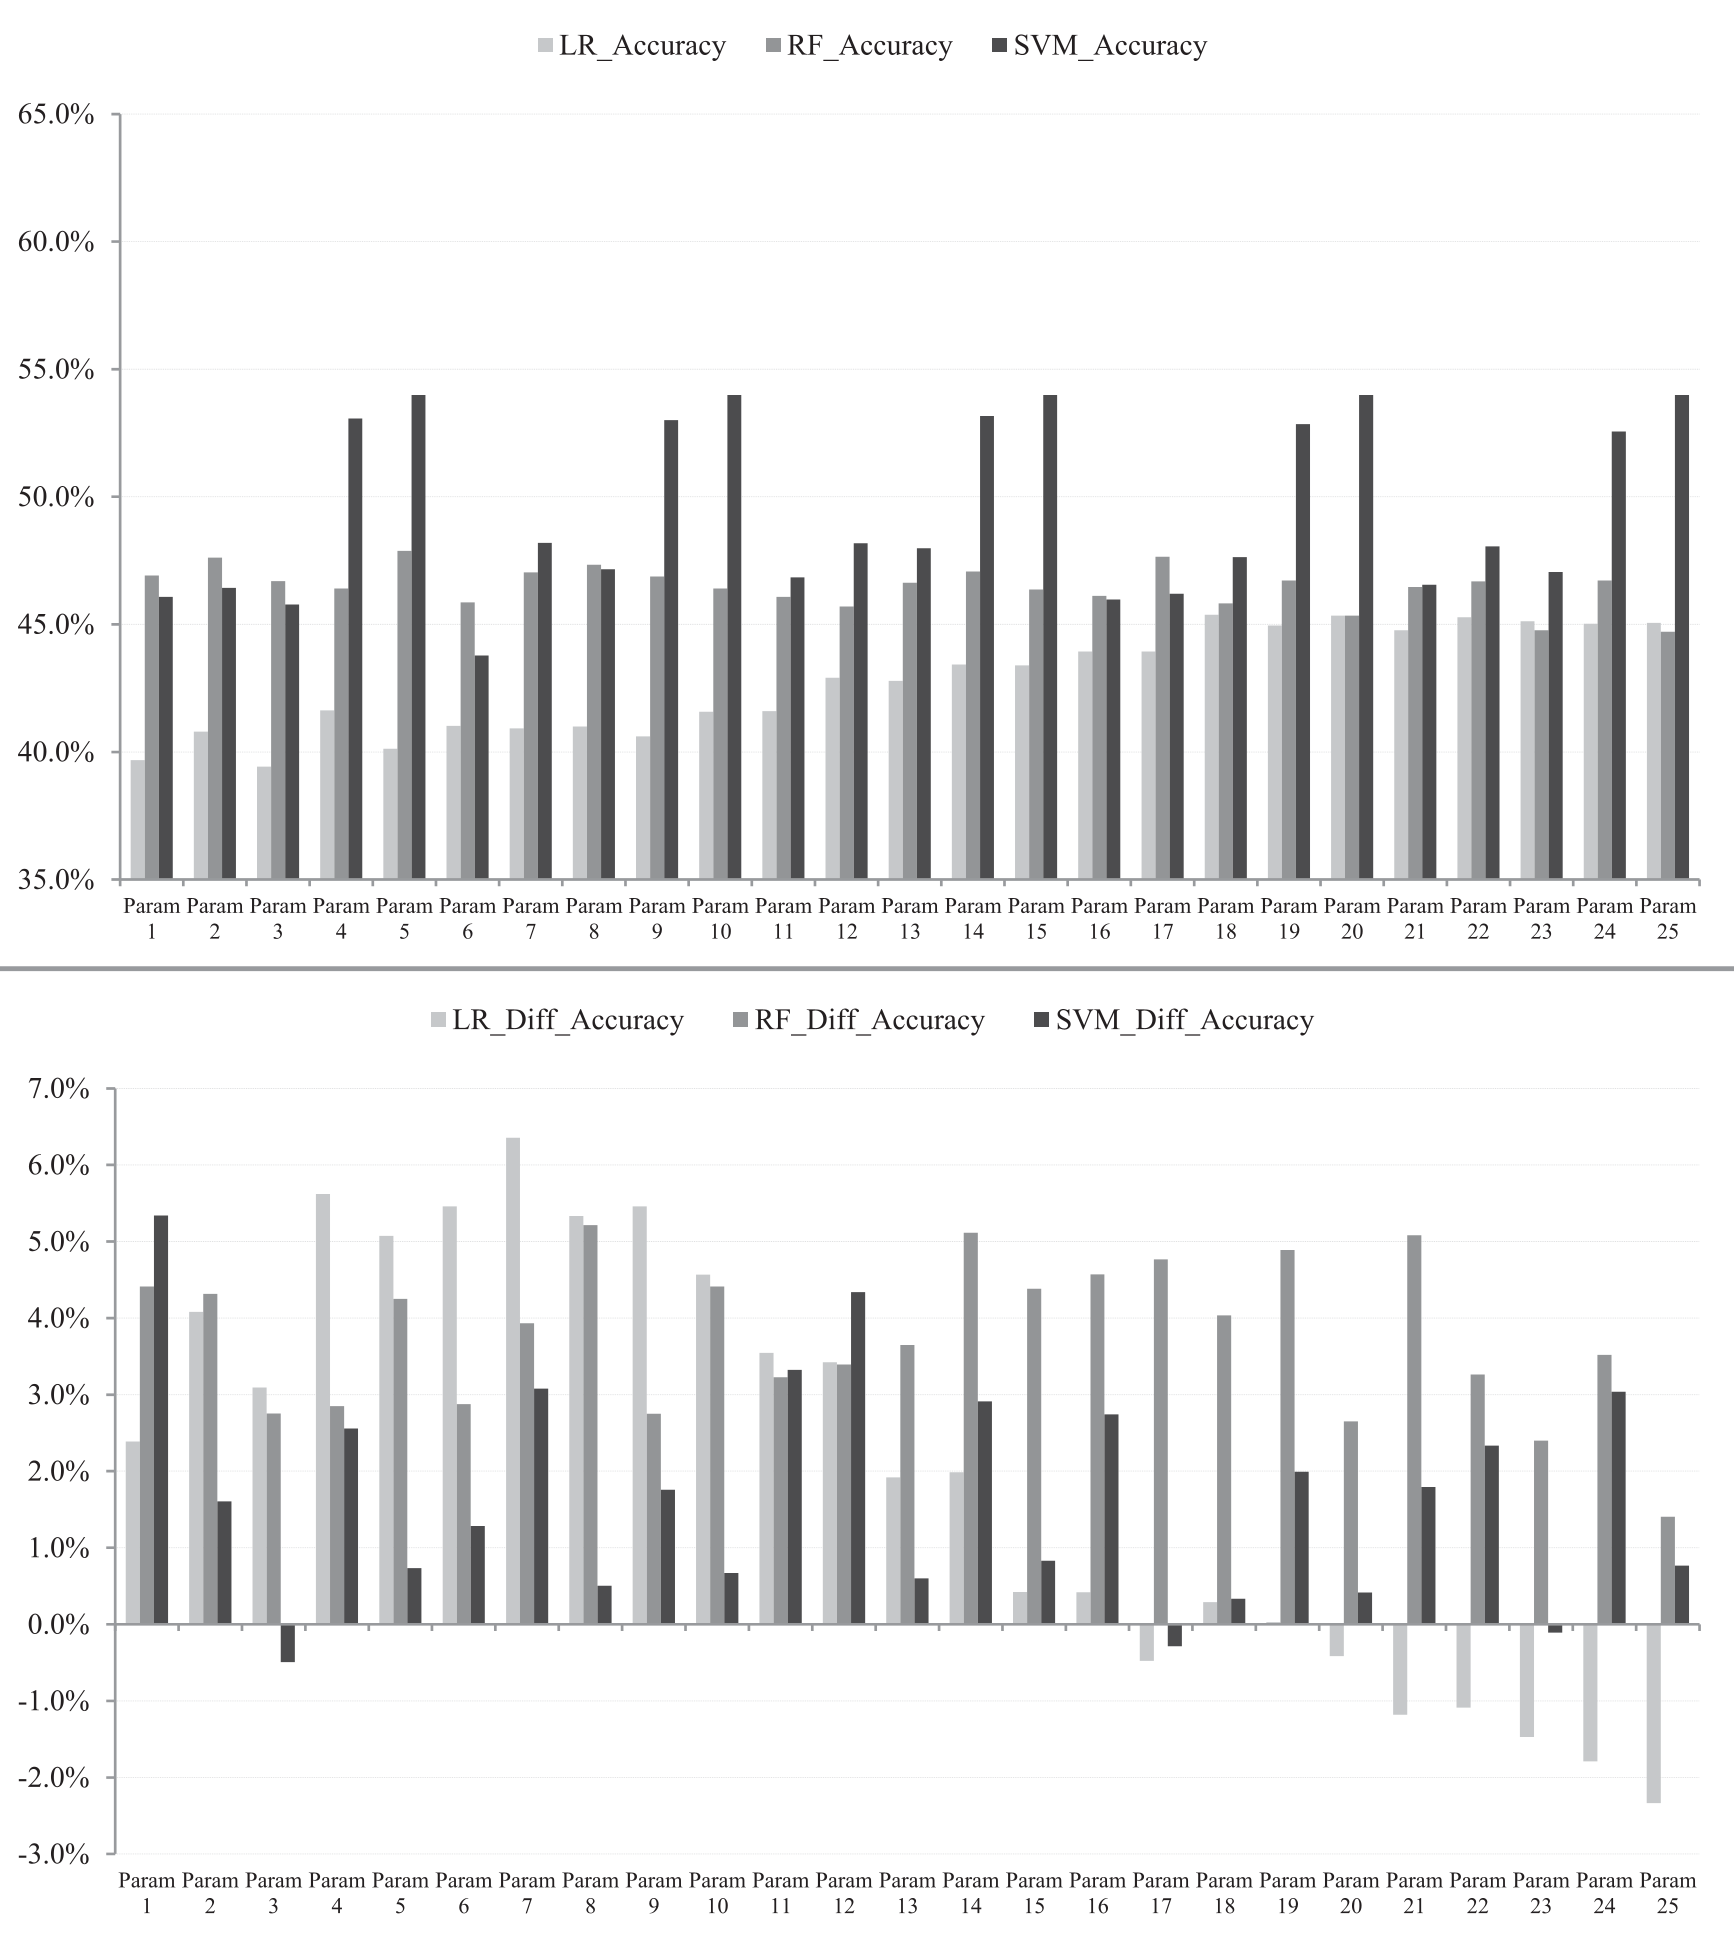
Strategy Implementation: Regional Allocation
The study also tested a Regional Allocation Strategy (Developed Markets vs. Emerging Markets). By identifying which region was becoming more "central" or "unstable" in the network, the SVM model successfully improved the profit of a long/short regional strategy by nearly 3% annually compared to the baseline.
Critical Analysis & Conclusion
This paper is a pioneer in turning "Systemic Risk Theory" into a "Practical Trading Strategy."
- Takeaway: Network topology is not just for academics; it is an essential feature for any ML model attempting to forecast global asset classes.
- Limitations: The study primarily focuses on volatility. Future work should integrate other "nodes" such as FX rates, Commodities, and Interest Rates into the graph.
- The Future: With the rise of Graph Neural Networks (GNN), we expect this field to move from static statistical models to dynamic, deep-learning architectures that can learn the "physics" of global finance in real-time.
For practitioners, the message is simple: Stop looking at your own market in a vacuum. The network is always watching.