
Sensing the City Pulse: Instagram as a Scalable Urban Outlier Detector
Expert Systems With Applications
This paper introduces an expert system for urban outlier detection using geolocated Instagram posts. By leveraging a density-based clustering algorithm (DBSCAN) across a two-phase Training/Detection framework, the system models the "pulse of the city" to identify unusual crowd behaviors without dedicated physical infrastructure.
TL;DR
Researchers have developed an automated system that uses Instagram's geolocated metadata to monitor the "heartbeat" of a city. By applying adaptive DBSCAN clustering to historical data, the system defines what a "normal" crowd looks like at any given time and place, allowing it to instantly flag anomalies—ranging from massive conventions to the eerie silence of a city during a blizzard.
Background & Motivation: Moving Beyond Video Surveillance
Traditional smart city management is a resource hog. Deploying cameras and hiring staff to monitor feeds is expensive and fraught with privacy concerns. While Social Media (Twitter, Foursquare) has been used as an alternative, most models fail because they only look for "loud" events (high tweet volume).
The authors argue that true urban sensing requires understanding the normal pulse of the city. A silence in a usually busy Times Square is just as much of an outlier as a riot in a quiet park. The challenge lies in defining "normal" in a way that respects the shifting dynamics of time (day vs. night) and geography.
Methodology: The Two-Phase Pulse Modeling
The system operates via a robust two-stage pipeline:
1. The Training Phase (Building the Baseline)
Instead of assuming a static density, the model aggregates roughly 6 months of data.
- Temporal Slicing: Data is divided into 30-minute "chunks."
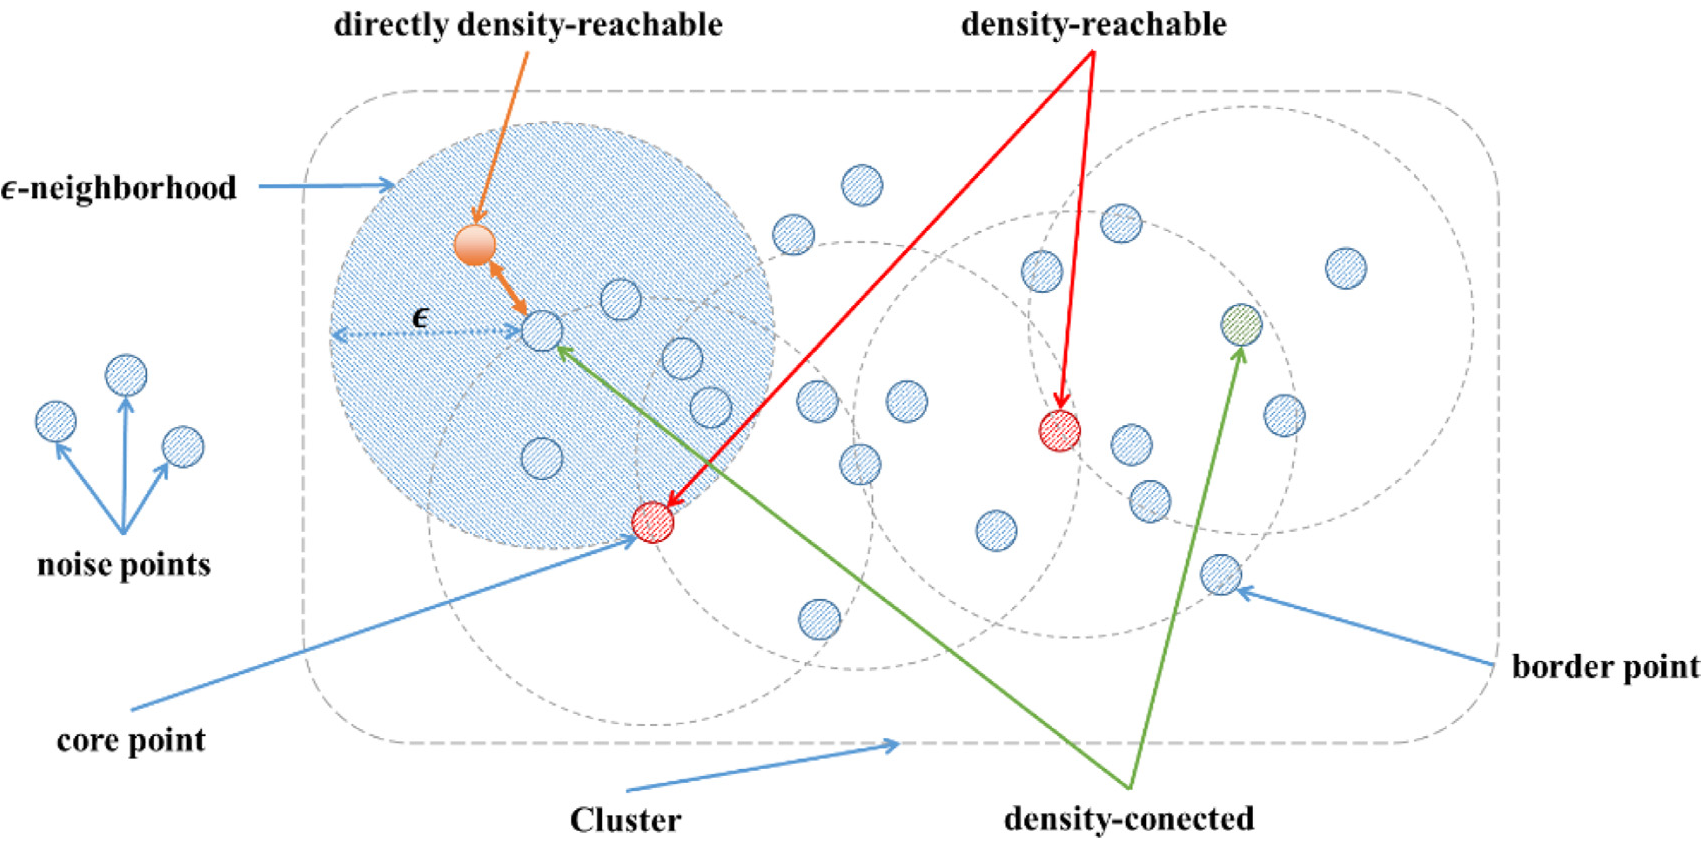
- Reference Clustering: Using DBSCAN, the system identifies persistent activity zones (e.g., Central Park, Times Square).
- Statistical Boundaries: It calculates quartiles (Q1, Q3) for each cluster to define the "normal" number of people expected in that specific 30-minute window of the week.
2. The Detection Phase (On-the-fly Outliers)
When new data arrives, the system doesn't just look for "big numbers." It matches new clusters to the Reference Clusters.
- PO (Position Outlier): A crowd appears where there usually isn't one.
- LEO/UEO (Lower/Upper Extreme Outlier): A normally busy area is dead, or a quiet area is overflowing.
 The methodology workflow: Transitioning from offline parameter estimation to real-time outlier detection.
Experimental Validation: NYC and the Jonas Storm
The authors tested their model using a massive dataset of 3,498,212 Instagram posts from New York City. Two specific scenarios validated the system's sensitivity:
- The High-Density Event: During New York Comic Con, the system flagged extreme Upper Outliers (UEO) at the Jacob Javits Center. The model correctly identified that the cluster at this location was significantly denser than the "Reference" for a typical October weekend.
- The Low-Density Event (Jonas Storm): On January 23, 2016, a massive blizzard hit NYC. While most systems look for more activity, this model flagged Lower Extreme Outliers (LEO) across the city as usually high-traffic areas went dark.
 Comparative table showing the stark difference in outlier types between a normal Saturday (Pre-Jonas) and the storm day (Jonas).
Critical Insight: Why Instagram Beats Twitter
A fascinating technical takeaway is the choice of data source. Most researchers use Twitter because of its open API. However, the authors demonstrate that Instagram provides a much higher density of geolocated content. Only ~1.45% of Tweets are geotagged, whereas Instagram's platform culture is inherently location-centric, providing a much higher resolution "sensor" for urban density.
Conclusion & Future Outlook
This work shifts the paradigm of urban sensing from "watching" to "listening" to the digital footprints of citizens. By modeling the city as a living organism with a predictable pulse, we can detect anomalies more accurately and at a lower cost than ever before.
Limitations: The system relies on users proactively sharing locations. If a demographic (e.g., the elderly) doesn't use Instagram, their "pulse" is invisible. Future iterations could integrate text and image analysis (e.g., CNNs) to understand why an outlier is occurring, not just that it is occurring.