
Beyond the Follower Count: Decoding Developer Influence on GitHub
Expert Systems With Applications
This paper introduces a multi-dimensional framework to quantify user influence on GitHub using a Following-Star-Fork-Activity approach. By integrating metrics like UserRank (PageRank adaptation), HITS, and H-index for projects, the authors provide a comprehensive evaluation of developer impact beyond simple follower counts.
TL;DR
GitHub is more than a code hosting site; it’s a massive social graph. This paper argues that looking at followers alone is a "fallacy." Instead, it proposes a comprehensive framework combining Following, Starring, Forking, and Activity metrics, aggregated via the Borda Count method, to identify the real "movers and shakers" of the open-source world.
Problem & Motivation: The Follower Fallacy
In mainstream social media (like Twitter/X), follower counts are the gold standard for influence. However, in technical communities, a user might have thousands of followers simply because they are a "celebrity" founder, yet they may no longer contribute active code. Conversely, a genius architect might have fewer followers but maintains the libraries that power half the internet.
The authors identify a critical gap: existing methods are too one-dimensional. To solve this, they treat GitHub as a complex network where an "edge" isn't just a follow; it's a star, a fork, or a pull request.
Methodology: The Multi-Facet Framework
The core of the methodology lies in looking at the developer from four distinct angles:
- Centrality (Social Graph): Using UserRank (a custom PageRank) and HITS. The intuition is that influence is recursive—being followed by an influential developer is worth more than being followed by a "bot" account.
- Productivity (H-Index): Borrowing from academia, the authors calculate an H-Star and H-Fork index. If a developer has an H-index of , it means of their projects have each received at least stars/forks. This filters out "one-hit wonders."
- Active Contribution: Measuring the volume of Commits, Issues, and Pull Requests over a rolling 3-month window.
- Borda Count Integration: To avoid the bias of any single metric, they use a voting-theory approach (Borda Count) to synthesize a final score.
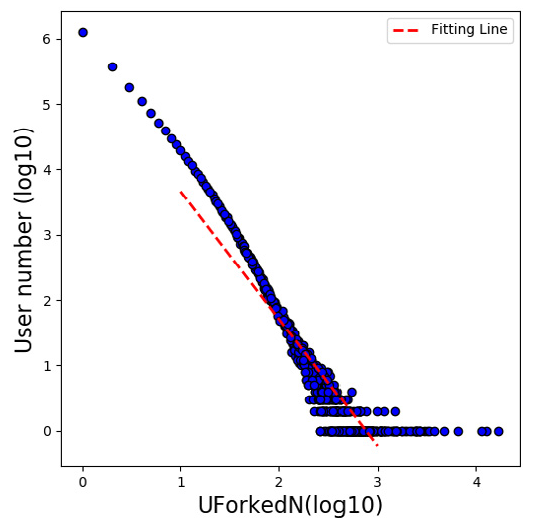 Figure 1: The proposed workflow for data collection, preprocessing, and multi-perspective influence analysis.
Data Insights & Power Laws
The study analyzed a massive dataset (2008–2017) involving over 16 million users. A key finding was that GitHub attributes strictly follow a Power Law Distribution (). Most users have near-zero influence, while a tiny elite controls the majority of the network's attention.
Interestingly, they found that "Followee" and "Repository" numbers deviate more from the straight power-law line, suggesting that these are proactive traits—users can choose to follow many people or create many repos, but they cannot "force" others to follow them back.
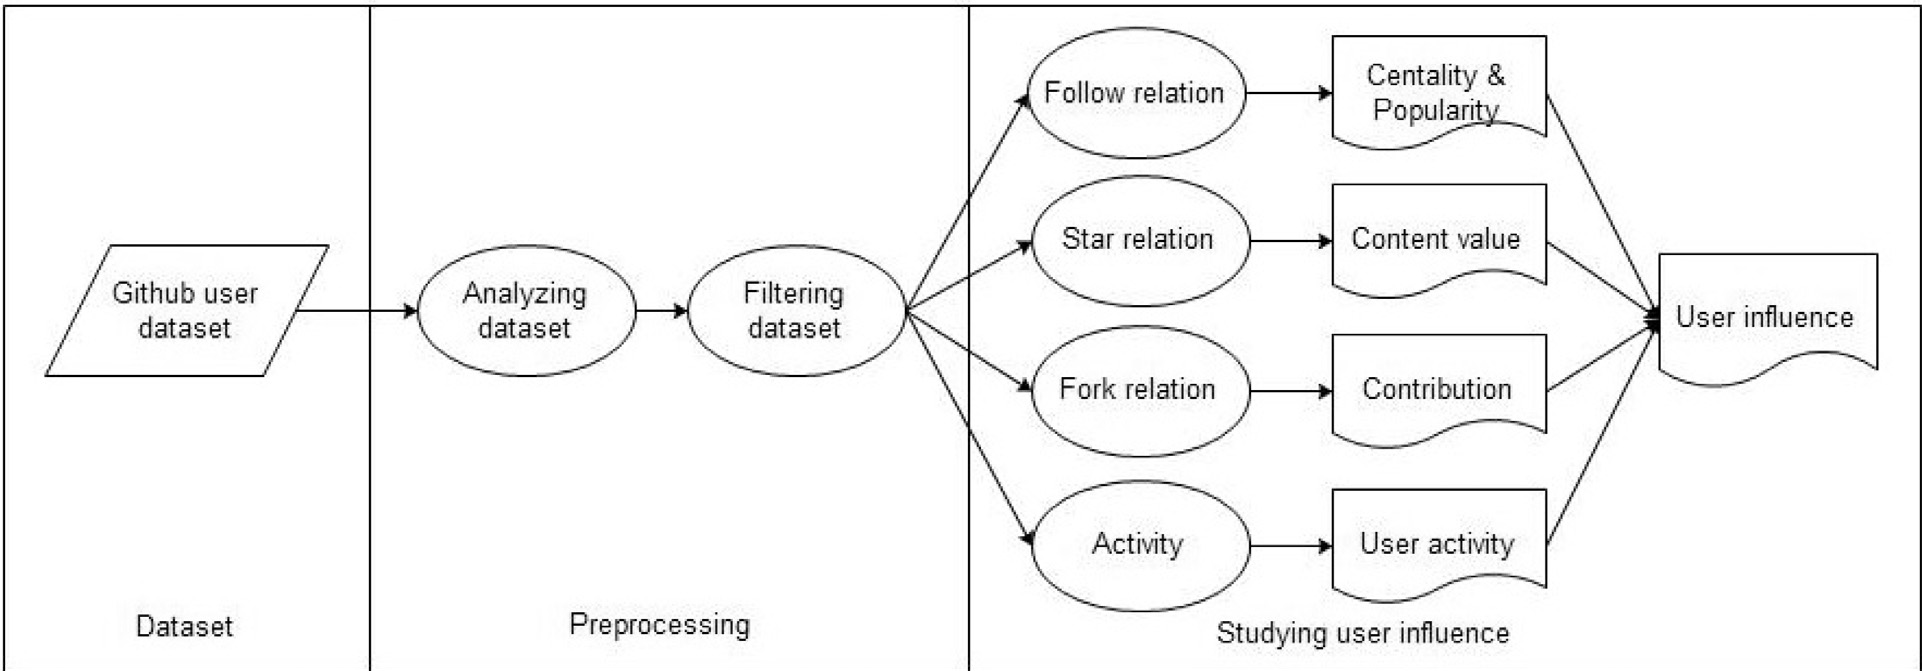 Figure 2: Power-law distributions of followers, stars, and forks across the GitHub population.
Experiments and Validation
How do we know who is truly influential? The authors validated their rankings by tracking the "Variation Ratio" of followers over a subsequent 14-month period.
The results were telling:
- The top 10 users ranked by the Borda Count saw a follower increase of 15.67%.
- The top 10 users ranked by Follower Count alone only saw an increase of 10.11%.
This proves that the multi-dimensional framework is better at identifying "rising stars" and high-value developers who are likely to gain more social traction over time due to their actual contributions.
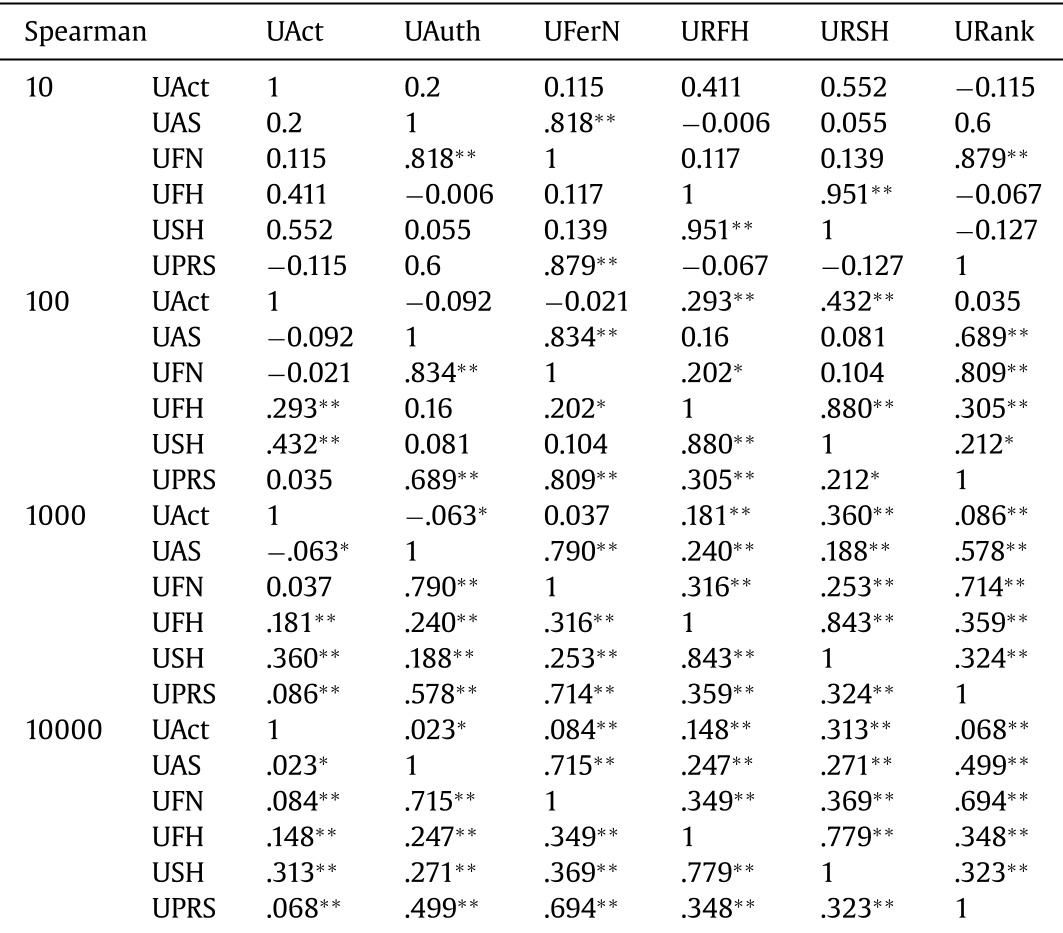 Figure 3: Spearman correlation between different measures shows that Activity (UAct) and project impact (URFH/URSH) provide distinct information that Follower counts miss.
Critical Analysis & Conclusion
This work successfully deconstructs the "popularity" myth on GitHub. By integrating H-index and activity, it prioritizes Content Value over Social Noise.
Takeaway: For recruiters or open-source maintainers, look for high H-Star and UserRank scores rather than just follower counts.
Limitations: The study relies on historical data up to 2017/2018. Since then, GitHub has introduced "Sponsors," "Discussions," and "Actions," which provide even more granular data for modern influence analysis. Furthermore, the model doesn't fully account for "Bot" accounts that inflate activity metrics, though the authors did perform some basic "fake user" filtering.
Future Work: Integrating Natural Language Processing (NLP) to analyze the quality of comments and code, rather than just the quantity of actions, would be the next logical step in defining the "Expertise" dimension of influence.