
Exploratory Hierarchical Clustering: Bridging Data Mining and Precision Agriculture
Exploratory Hierarchical Clustering for Management Zone Delineation in Precision Agriculture
The paper introduces a novel two-phase hierarchical agglomerative clustering approach for management zone delineation in Precision Agriculture. It combines a k-means spatial tessellation with a constrained merging process to identify spatially contiguous field zones with similar soil characteristics.
TL;DR
Agriculture is no longer just about seeds and soil; it’s a high-resolution data discipline. This paper presents an Exploratory Hierarchical Clustering algorithm specifically designed to solve the "Management Zone Delineation" problem. By enforcing a spatial contiguity constraint, the authors ensure that the resulting field zones are not just statistically similar, but geographically continuous—making them actually usable for automated fertilizer machinery.
Context: This work positions itself as a practical alternative to "black-box" models, offering an interpretable, human-in-the-loop tool for agronomists.
The Problem: The "Island" Effect in Spatial Data
In Precision Agriculture, sensors collect data on a grid (e.g., every 10x10 meters). When researchers applied standard algorithms like k-means or Fuzzy C-Means to this data, they encountered a major headache: fragmentation.
Because these algorithms only look at attribute similarity (e.g., nitrogen levels) and ignore location, they produce "scattered" clusters—tiny islands of one zone type inside another. A farmer cannot reality-check or drive a tractor to fertilize 500 tiny, disconnected dots.
Furthermore, existing spatial algorithms like DBSCAN rely on density differences. Since agricultural sensor data is collected on a uniform grid, there are no density differences to find, rendering those tools useless.
Methodology: The Two-Phase Power Move
The authors' insight is grounded in Spatial Autocorrelation: the physical reality that points closer together are more likely to be similar than points far apart.
Phase 1: Spatial Tessellation
Instead of starting with 1,080 individual points, the algorithm begins by grouping neighboring points using k-means on their spatial coordinates only. This creates a "Voronoi-like" starting map, significantly reducing computational complexity for the next step.
Phase 2: Constrained Merging
The core innovation lies in the merging criteria. The algorithm uses Average Group Linkage but adds a "Contiguity Factor" ().
- Hard Constraint: In the beginning, only clusters that physically touch (neighbors) can be merged.
- Soft Constraint: As the algorithm progresses, the allows non-adjacent clusters to merge if they are exceptionally similar.
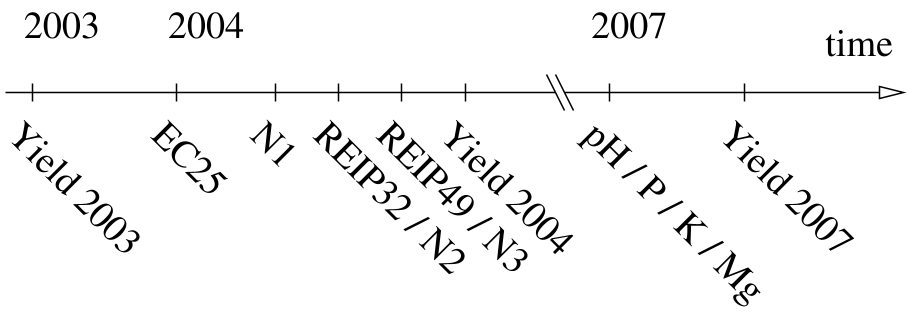 Figure 1: Timeline of data attributes and spatial distribution. Note the inherent spatial structure in soil properties.
Experimental Evidence
The authors tested the approach on a multi-variate dataset including pH-value, Phosphorus (P), Potassium (K), and Magnesium (Mg).
- Iterative Evolution: Starting with initial small zones, the algorithm merged them down to 28, and eventually to 6 major zones.
- Biological Validation: The final clusters weren't just random shapes; they corresponded to distinct chemical profiles (e.g., "Low pH / Low P" zones vs "High pH / High P" zones).
- The Failure Case: The authors honestly noted that for human-controlled variables (like fertilizer application strips) where spatial autocorrelation is intentionally broken, the algorithm fails—proving that the "Spatial Insight" is the true engine of this method.
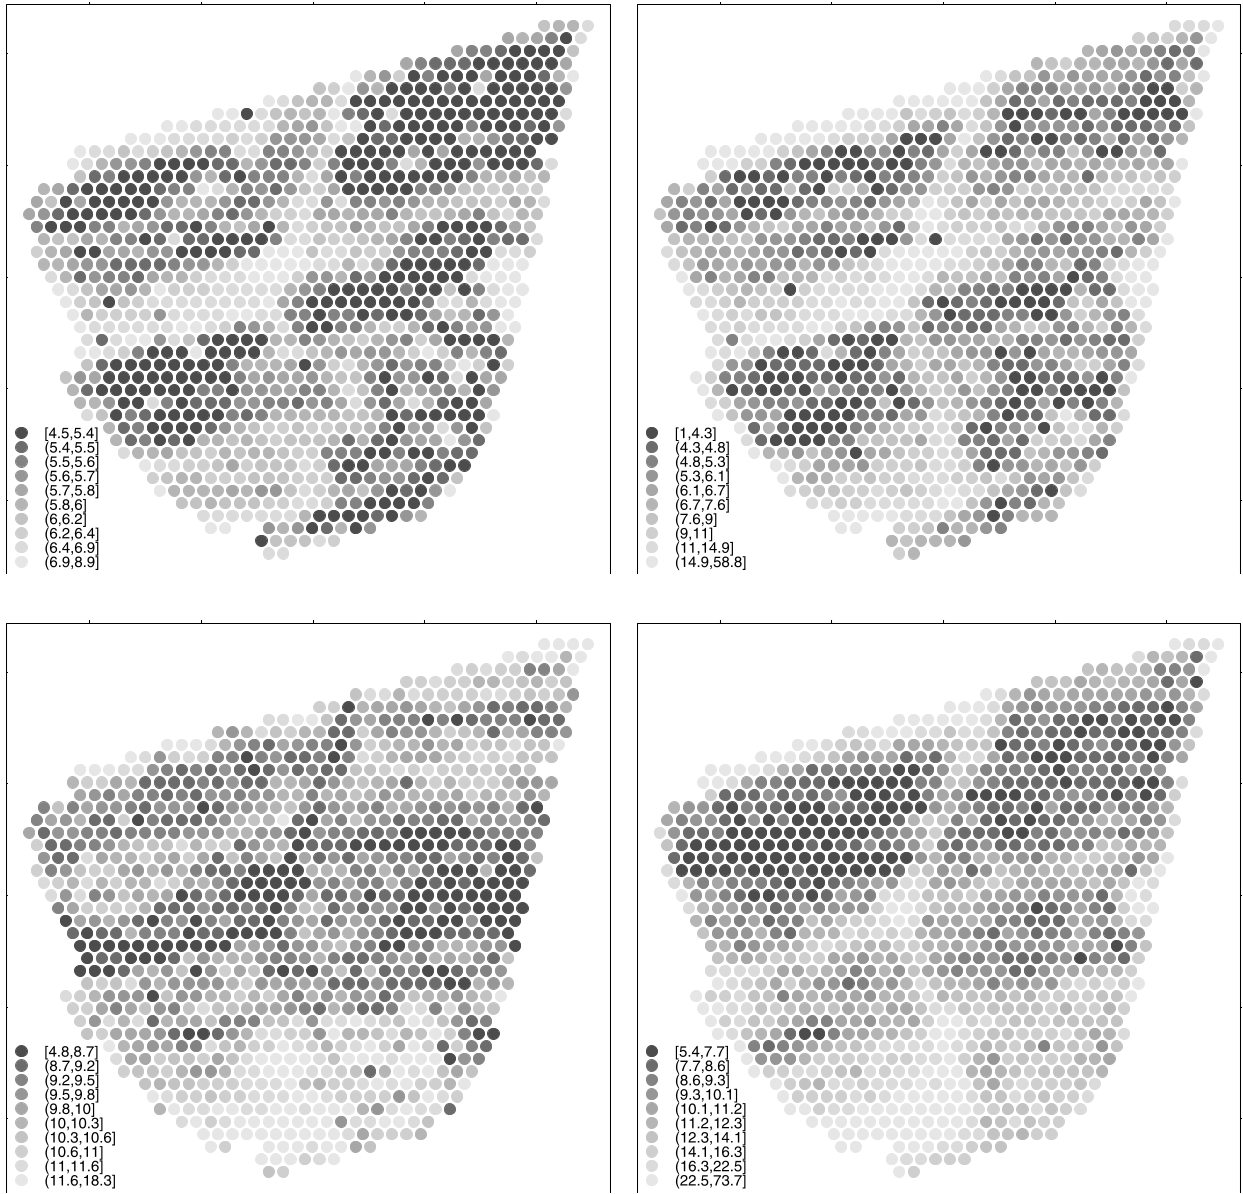 Figure 2: The progression of merging. From a high-resolution grid (top left) to manageable, contiguous management zones (bottom right).
Critical Insight & Conclusion
The brilliance of this paper is its Inductive Bias. By baking the "spatial neighbor" requirement directly into the hierarchical tree, the authors bypassed the need for complex post-processing or "smoothing" of clusters.
Takeaway for Practitioners:
- Don't ignore the grid: If your data has a physical location, your algorithm should know about it.
- Interpretability > Complexity: In specialized fields like agriculture, a hierarchical model that a human expert can "stop" at the right level of granularity is often superior to an automated deep learning black box.
Limitations: The reliance on k-means for initial tessellation assumes the grid is relatively clean. In cases of irregular topographical boundaries, a Delaunay-triangulation-first approach might be more robust.