
The Power of Position: How Network Centrality Dictates Information Flow
Exploring Temporal Communication Through Social Networks
This study investigates the relationship between an actor's structural position in a social network and their information dissemination capability. Using the Reality Mining dataset of mobile phone communications, the authors apply five centrality measures (degree, closeness, betweenness, and eigenvector) to demonstrate that highly central actors are significantly more effective at spreading information.
TL;DR
In the digital age, being "well-connected" is more than a cliché—it is a measurable mathematical advantage. This study analyzes 350,000 hours of mobile usage data from the Reality Mining project to prove that an individual's structural position in a social network (their "centrality") is the most accurate predictor of their ability to disseminate information. By combining metrics like Betweenness and Eigenvector centrality, the research reveals that the most effective communicators are those who act as gateways between clusters.
Problem & Motivation: Beyond Simple Usage Graphs
Most studies on mobile phone behavior focus on how much people use their devices. However, this paper argues that who you talk to and where you sit in the overall social architecture is far more critical for information flow.
The authors identified a gap in existing Human-Computer Interaction (HCI) research: we know people share information, but we struggle to identify the "hubs" who can most effectively spread a message across an entire organization. Why do some people with fewer calls have more influence than those who are constantly on the phone? The answer lies in the topology of the network.
Methodology: Mining Social Reality
The researchers utilized the Reality Mining dataset, involving 100 smart phone users at MIT. To ensure the data reflected meaningful social relationships, they applied a "bootstrapping" threshold, requiring at least 5 interactions between actors to validate a tie.
The Centrality Toolkit
The study doesn't rely on a single metric. Instead, it employs a multi-dimensional view of "importance":
- Degree Centrality: Simple popularity (number of ties).
- Closeness: How fast an actor can reach everyone else.
- Betweenness: The "Control" factor—acting as a bridge between groups.
- Eigenvector: The "Prestige" factor—being connected to other influential people.
To quantify dissemination, they introduced the Information Dissemination Index:
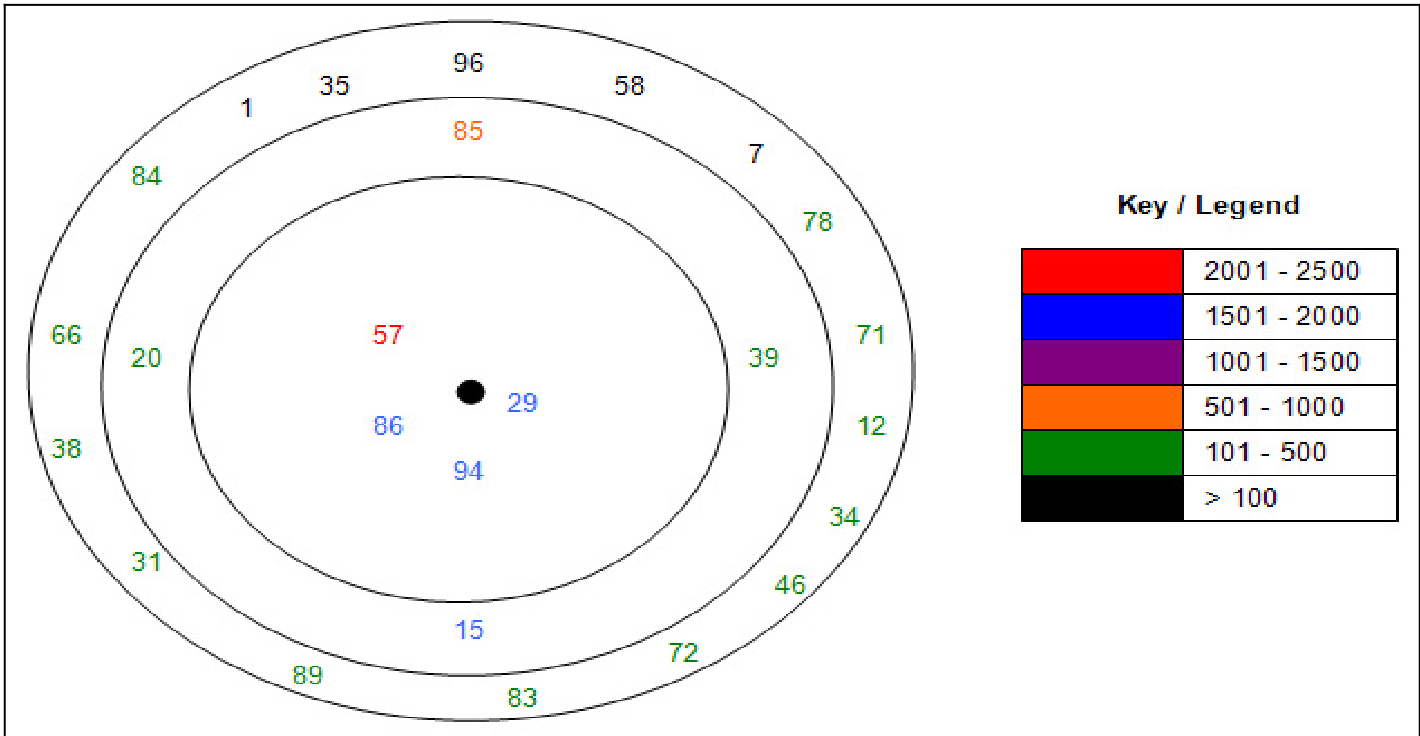 Figure 1: Multi-mode analysis where actors closer to the center possess the highest aggregate centrality across all measures.
Experiments & Results: The "Gatekeeper" Effect
The analysis revealed that communication is not evenly distributed but occurs within cliques (sub-groups).
Key Findings:
- The SOTA Correlation: Actors with high "Out-degree" (sending many calls) were the most active disseminators, but Betweenness revealed hidden influencers. For instance, Actor 35 ranked low in raw call volume but 7th in Betweenness, acting as a "peripheral facilitator" who bridges separate clusters.
- The Inner Circle: As seen in the multi-mode diagram, the actors with over 1,500 interactions were exclusively located in the two innermost circles of the centrality graph.
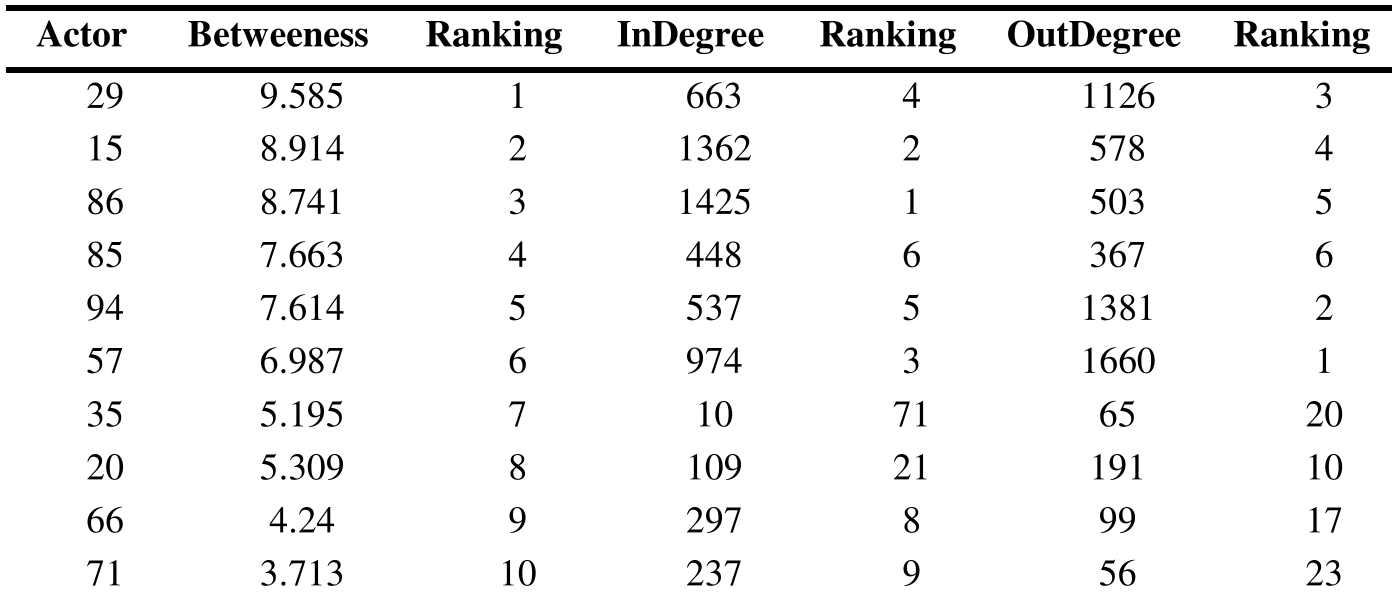 Table 1: Comparing Betweenness vs. Degree. Notice how rankings shift, highlighting different types of influence.
Critical Analysis & Conclusion
The Takeaway
The study confirms that structural position is the "DNA" of information flow. If you want to spread an idea in a network, you shouldn't just look for the loudest person; you should look for the person whose removal would break the network apart (high Betweenness).
Limitations & Future Work
While the study provides a robust snapshot, it treats the 9-month period as a static aggregate. The authors acknowledge that temporal dynamics (how networks change month-to-month) and multiplex relations (combining SMS, voice, and physical proximity) are the next frontiers. For future HCI tools, building "contextualized awareness" means recognizing these shifting hubs in real-time.
By understanding these structures, organizations can better select project leaders who aren't just "busy," but are strategically positioned to coordinate resources and knowledge.