
LifeSpec: Decoding the Spectrum of Urban Lifestyles through Big Data
We know how you live: exploring the spectrum of urban lifestyles
This paper introduces LifeSpec, a data-driven framework for exploring and hierarchically summarizing urban lifestyles. It combines a cross-domain account linking algorithm with a novel nonparametric Bayesian approach called Relational Hierarchical Latent Dirichlet Allocation (RH-LDA) to model human behavior and social links across 493 cities.
TL;DR
LifeSpec is a pioneering framework that bridges the gap between our online digital footprints and offline physical lifestyles. By linking accounts across platforms like Twitter, Foursquare, and Yelp, and applying a novel RH-LDA model, researchers can now visualize "lifestyle spectrums"—hierarchical trees that map how different social groups (from software engineers to local subcultures) live, move, and consume.
The Motivation: Moving Beyond 10-Year Census Cycles
For decades, understanding how urban populations live was the domain of sociologists armed with slow, expensive, and often biased surveys. The primary pain points were:
- Temporal Lag: National censuses are updated once a decade.
- Granularity: Survey data rarely captures the hour-by-hour nuances of daily life.
- Self-Reporting Bias: People often misremember or intentionally misrepresent their habits.
The authors argue that our "digital footprints"—the check-ins we post, the music we stream, and the social links we form—serve as a high-fidelity mirror of our actual offline behavior.
Methodology: Connecting the Dots and Modeling the Spectrum
1. The IC O N N E C T Algorithm
The first hurdle was the "Silo Problem": data is scattered across different platforms. The authors utilized Hub Sites (like Foursquare/Jiepang) where users voluntarily link their Twitter or Facebook accounts. The IC O N N E C T algorithm uses a Union-Find structure to merge these disjoint accounts into a single "Equivalence Class" (a unique user) in near-constant time.
2. RH-LDA: Social-Aware Hierarchical Modeling
The core innovation is Relational Hierarchical Latent Dirichlet Allocation (RH-LDA). Standard topic models treat users as documents and footprints as words. LifeSpec goes two steps further:
- Hierarchical (hLDA): It builds a tree. The root represents universal urban behaviors, while branches represent specific lifestyles (e.g., "Nightlife Enthusiasts" vs. "Early-bird Professionals").
- Relational (RTM): It incorporates the "Homophily" principle—the idea that people with similar lifestyles are more likely to be socially connected.
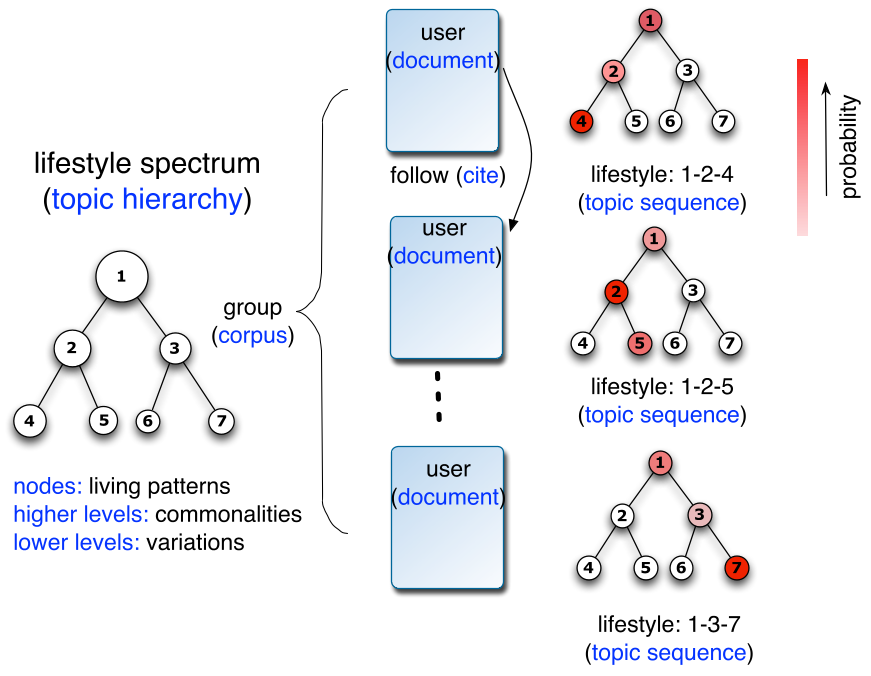
The lifestyle spectrum of Beijing citizens, showing common root patterns branching into specialized nodes.
Experiments: What Can 53 Million Footprints Tell Us?
The study analyzed nearly 1 million users in China, yielding fascinating cross-group insights:
Vocation & Education
The model clearly distinguished between financial practitioners (frequent business travelers checking into apartment hotels) and software practitioners (focused on programming books and office check-ins). It even segmented students from top-tier universities based on their unique consumption of arts vs. engineering content.
The "Gay Community" vs. The "Lesbian Community"
Through social graph visualization, the study revealed that the gay community exhibited much stronger social connectivity and more dominant "characteristic" living patterns (like specific gym culture and niche book interests) compared to the lesbian community.
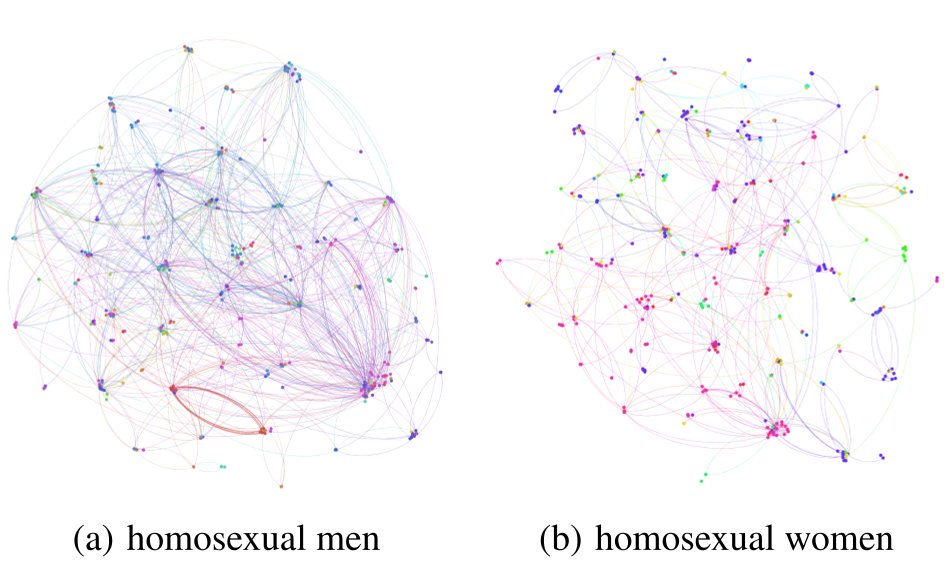
Social graphs showing the density of connections within homosexual communities across different cities.
Performance vs. Baselines
In a blind recognition study, participants identified the lifestyle spectrum of their own city with an 83.3% accuracy using RH-LDA, compared to only 66.7% for models that ignored social links.
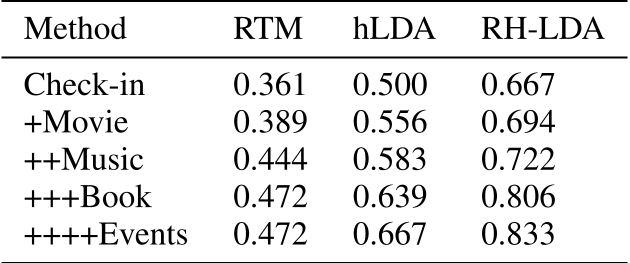
Table showing the Recognition Ratio (RR) improvements as footprint heterogeneity increases.
Critical Analysis & Future Outlook
Strengths: LifeSpec is one of the first systems to provide a mathematically rigorous way to define "lifestyle" as a path through a hierarchical tree. Its use of active self-disclosure for account linking is a clever way to mitigate some privacy concerns while maintaining data accuracy.
Limitations: As the authors admit, the data is skewed toward younger, tech-savvy "digital natives." Furthermore, while the footprints are rich, they don't capture the entire human experience—private home life remains a "dark zone."
Conclusion: This work sets a new bar for "Computational Sociology." As we move toward 2026 and beyond, the integration of even more diverse data (IoT sensors, payment records) into models like RH-LDA will likely make LifeSpec-style analysis the backbone of urban planning and precision retail.
Senior Editor's Note: The choice of a nonparametric Bayesian approach (nCRP) is particularly insightful here. It avoids the "k-means problem" where one must guess the number of lifestyle clusters in advance, allowing the data to dictate the complexity of the urban spectrum.