
Bridges over Data: Extracting Semantic Links Between Text and Charts
Extracting references between text and charts via crowdsourcing
This paper introduces a crowdsourcing pipeline designed to extract semantic references between text phrases and visual marks in charts (e.g., bars, lines). By employing automated clustering and merging techniques to unify multi-worker inputs, the system achieves a 27% improvement in precision and recall over individual workers, enabling interactive document viewers.
TL;DR
Charts and text are the "twin engines" of data storytelling, yet they often exist in silos within a document. This paper presents a sophisticated crowdsourcing pipeline that extracts fine-grained references between text phrases and visual marks. By mathematically merging the inputs of multiple workers, the authors created a system that "cleans" human noise, resulting in a 27% performance boost over individual effort and enabling truly interactive reading experiences.
The Motivation: Why Human-Chart Interaction is Broken
We’ve all seen it: a Pew Research report claims "Most people in 13 of 21 nations believe in hard work," while next to it sits a massive bar chart with 42 bars of different colors. To verify the claim, the reader's brain must perform high-latency "visual joins"—matching the text's "13 nations" to specific orange bars while ignoring the blue ones.
Existing SOTA methods in 2014 could extract data from charts (like the ReVision system), but they couldn't understand the semantic bridge—the "why" and "where" a specific sentence touches a specific data point.
Methodology: The "Cluster & Merge" Secret Sauce
The core innovation isn't just asking people to click on bars; it’s about how to handle the fact that people are often messy, lazy, or overly verbose.
1. The Microtask
Workers are given a paragraph and an interactive chart. They must highlight a phrase (e.g., "Turkey (15%)") and click the corresponding bar. However, one worker might highlight "Turkey (15%)" while another highlights the whole sentence.
2. Algorithmic Unification
This is the "Senior Academic" part of the paper. Instead of simple voting, the authors use:
- Subset Splitting: If Worker A selects a whole sentence and Worker B selects a specific phrase within it (linked to the same data), the system "subtracts" the smaller from the larger to find the minimal reference.
- Maximal Cliques: The system treats references as nodes in a graph. If two references are "close" (based on an F1-score distance), an edge is drawn. The algorithm then finds the most "connected" set of ideas to represent the true link.
 Figure: The three-stage pipeline from document segmentation to unified reference sets.
Experiments: Does the Crowd Scale?
The authors tested the pipeline on 40 paragraph-chart pairs from high-end sources like The Economist and The Guardian.
Key Findings:
- Crowd vs. Expert: A single worker is hit-or-miss (Distance: 0.54).
- Power of Merging: The clustering algorithm reduced the error distance to 0.39.
- Sentence vs. Phrase: The system is exceptionally good at sentence-level matching (0.22 distance), which is often "good enough" for UI/UX applications.
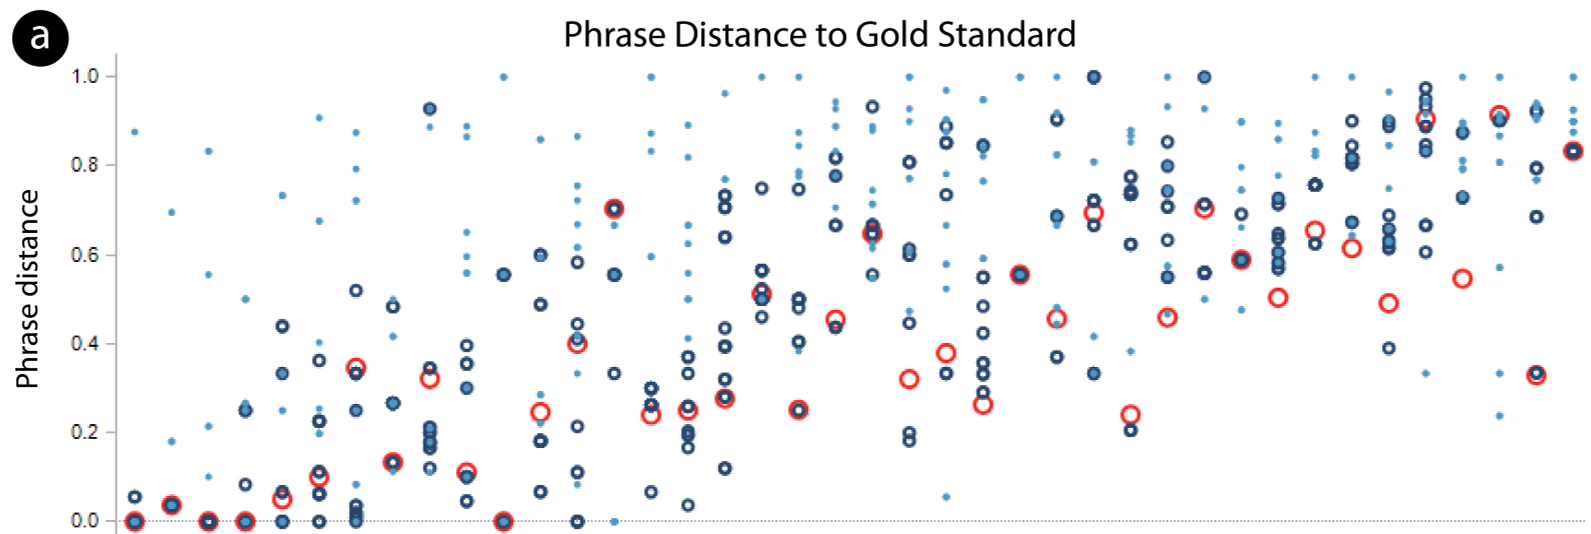 Figure: Performance improvement showing clustered results (red) significantly outperforming individual workers (blue).
Application: The Future of Reading
The practical payoff is an Interactive Document Viewer. When a user hovers over a text phrase, the corresponding bar in the chart glows. This reduces cognitive load and transforms static reports into "living" data explorations.
 Figure: Proof-of-concept viewer where text selection triggers visual mark highlighting.
Critical Insight & Conclusion
The true value of this work lies in its Inductive Bias toward "minimal references." By forcing the extraction to be as concise as possible, the authors provide a dataset structure that is far more useful for training future ML models than raw, noisy highlights.
Limitations: The system still relies on high-quality chart-to-data extraction (ReVision), which can fail on complex, "charjunk"-heavy visuals. Furthermore, in 2024, one might ask: "Can an LLM like GPT-4o do this better?" While LLMs are powerful, the clustering/merging logic defined here remains the gold standard for verifying and "grounding" AI outputs in human-centered truth.
Takeaway: To bridge the gap between text and vision, don't just trust one human—trust a crowd, and then filter that crowd through a rigorous geometric algorithm.