
Social Network Extraction: Deciphering Organizations from Partial Observations
On the Extraction and Analysis of a Social Network with Partial Organizational Observation
This paper presents a transformation-based framework for extracting social network graphs from disparate datasets with partial organizational observations, such as Facebook or intelligence databases. By mapping raw data onto a specialized social ontology and applying optimized graph algorithms, it achieves an automated reduction in complexity while identifying key organizational roles.
TL;DR
Analyzing an organization’s behavior often relies on "seeing" the connections between its members. However, real-world data is usually messy, incomplete, and buried in irrelevant details. This paper introduces a systematic approach to transform raw, noisy data into clean social network graphs. By using pattern-based translation and optimized centrality metrics, the researchers provide a scalable way for analysts to identify key players like "Information Brokers" and "Central Players" without being overwhelmed by data volume.
Background: The Challenge of Partial Observation
In both counter-insurgency and corporate intelligence, we rarely have a complete blueprint of an organization. We only have partial observations—a log of comments on a post, a shared event, or a proximity record.
The authors point out a critical gap: existing tools like UCINET are built for sociologists who already have clean data. Modern intelligence analysts, however, deal with datasets where the "social" aspect is hidden behind a different ontology (the way data is structured). The goal is to move from a data graph (showing "Person A liked Post X") to a social graph (showing "Person A is likely connected to Person B").
Methodology: From Raw Data to Actionable Graphs
1. Graph Translation through Pattern Matching
The core of the paper is a transformation-based approach. Instead of manually drawing lines, the authors define a "pattern"—for example, a string where Person A -> Post X -> Person B. If this pattern exists, the system infers a social link between A and B.
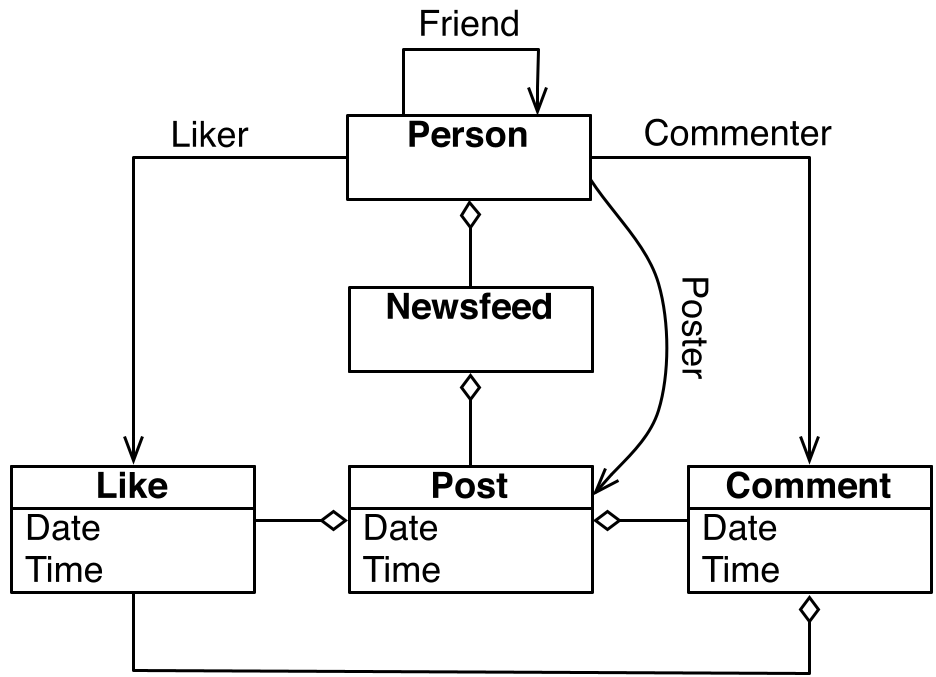 Figure 1: The original complex metadata structure highlighting messy relationships like "Liker" and "Commenter".
By stripping away the intermediate "Post" or "Event" nodes and keeping only the inferred social entities, the graph's complexity is drastically reduced (see Figures 4 and 5 in the paper for the visual "pruning" effect).
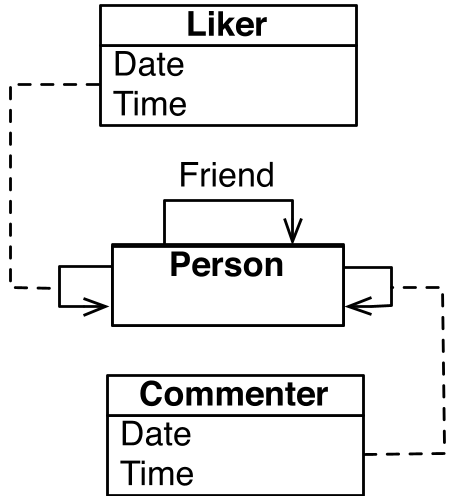 Figure 2: The refined metadata structure focusing strictly on person-to-person relation classes.
2. Scalable Analysis Metrics
Once the graph is "socialized," the paper identifies individuals based on their structural role:
- Central Players: High degree/closeness centrality; they are the "hubs."
- Information Brokers: High betweenness centrality; they are the "bridges" between different groups.
- Peripheral Players: Low scores locally, but potentially key brokers in other unmapped networks.
To handle large data, the authors use a Clique Approximation Factor (K). While finding true cliques is NP-Hard, they use a linear-time O(N + L) traversal to find sub-graphs where nodes meet a specific neighbor density threshold.
Experimental Insights & Results
The authors implemented these algorithms within the ATRAP (Asymmetry Threat Response and Analysis Program) framework. By testing on Facebook datasets, they demonstrated that:
- Complexity Reduction: The translation process successfully prunes non-social nodes (equipment, events), allowing analysts to focus on human dynamics.
- Temporal Sensitivity: By tracking Network Density () over time, analysts can detect sudden shifts in organizational cohesion or the emergence of new leadership.
- Visual Distinction: The tool clearly differentiates between "Hubs" (surrounded by many) and "Brokers" (connecting isolated clusters).
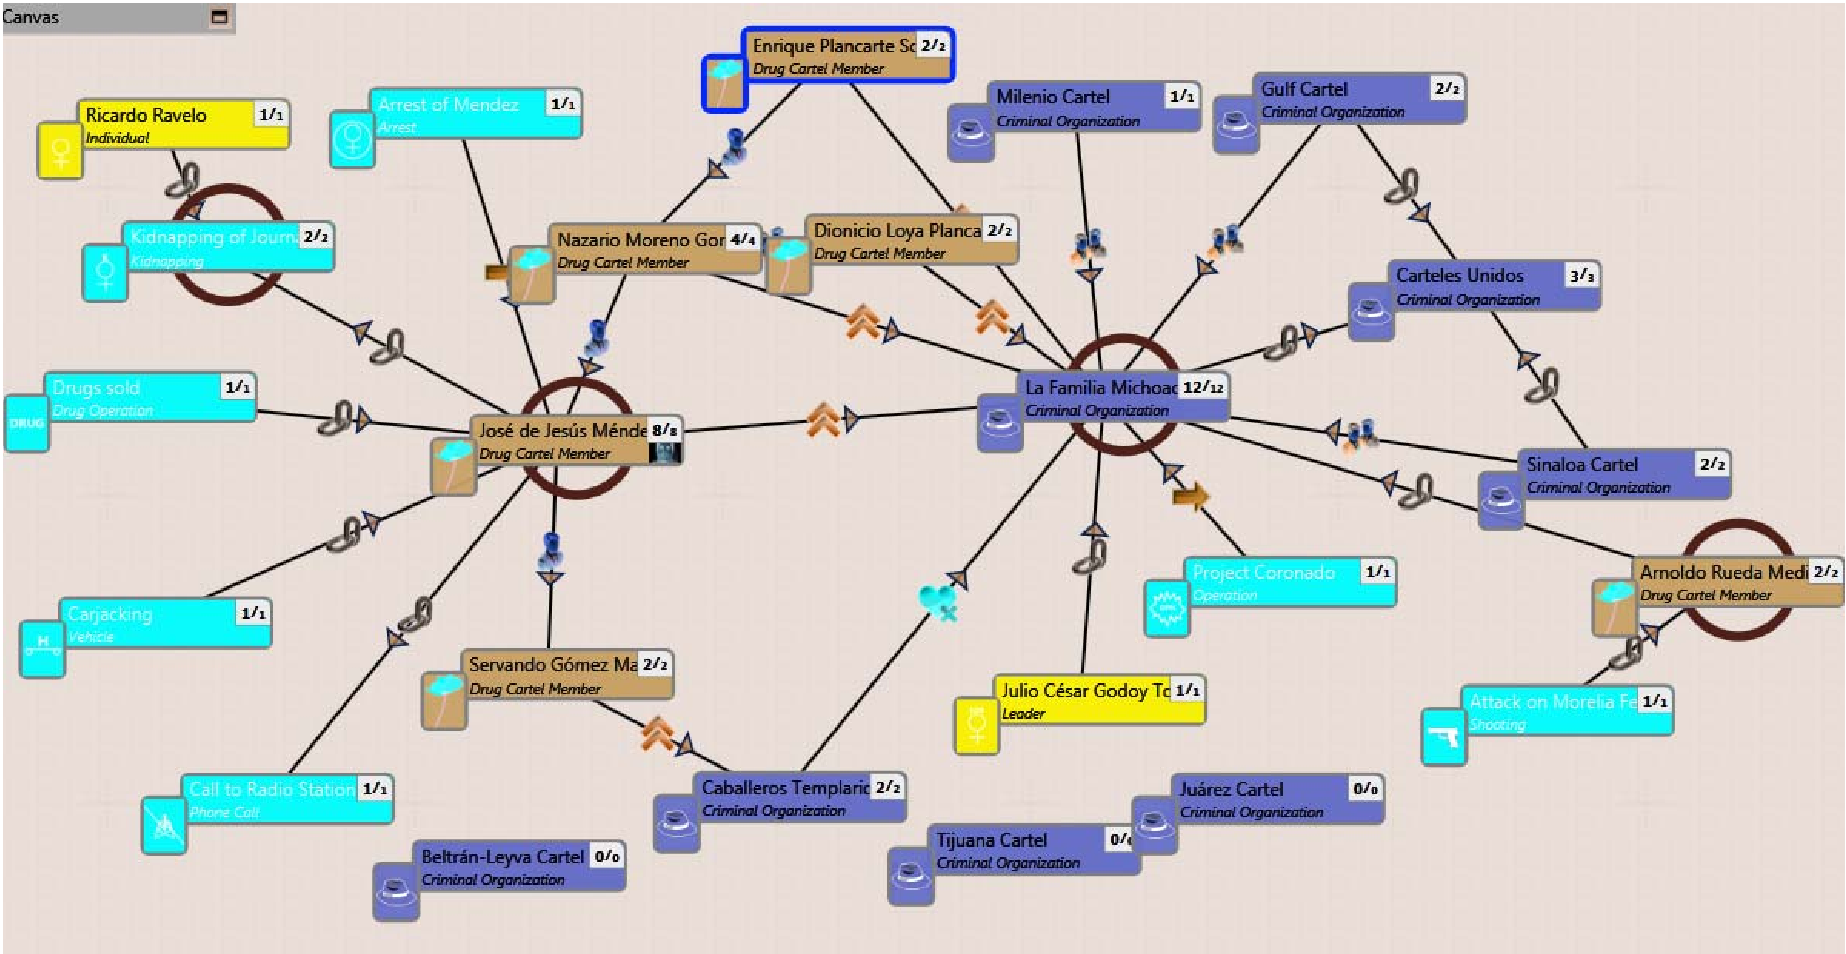 Figure 7: Visualization in ATRAP identifying "Brokers" who control the flow of information between clusters.
Critical Analysis & Conclusion
Takeaway
The paper effectively bridges the gap between raw database management and high-level social network analysis. Its strength lies in the Graph Translation algorithm, which allows the same analytical tools to be applied to diverse data sources (from social media to military intelligence) simply by changing the pattern definitions.
Limitations
- User Dependency: The quality of the final social graph relies heavily on the analyst’s ability to define the correct "patterns" for inference.
- Static Patterns: The current translation uses a fixed string of entities; future work could benefit from more flexible, fuzzy matching or machine-learning-based relationship inference.
Future Outlook
This work sets the stage for "Human-in-the-loop" AI systems where the machine handles the heavy lifting of graph pruning and metric calculation, while the expert provides the domain-specific logic needed to interpret "partial observations."