
Knowledge Mining: Solving the "Mixed Information" Puzzle in High-Res Rice Extraction
Extraction of Rice Cropping Area from High Resolution Remote Sensing Image Based on Sample Knowledge Mining
This paper introduces a novel rice cropping area extraction method based on "Sample Knowledge Mining" for high-resolution satellite imagery. It utilizes a hierarchical approach moving from spectral-based units to polygon-level analysis, achieving an Overall Accuracy of 96.77% and a Kappa coefficient of 0.94 in Zhejiang Province.
TL;DR
Extracting rice paddies from high-resolution imagery is surprisingly difficult because a single field isn't just "green"—it's a mixture of water, soil, and vegetation. This paper proposes a Sample Knowledge Mining strategy that learns the "recipe" of these components using spatial autocorrelation and the Earth Mover's Distance (EMD). The result is a highly accurate (96.77% accuracy) system that avoids the pitfalls of traditional pixel-based noise.
Problem & Motivation: The Curse of High Resolution
In low-resolution imagery, a rice field is a single pixel. In high-resolution imagery (like GF-2's 0.8m), a rice field is a chaotic collection of details:
- Spectral Diversity: Differences in sowing time and water levels mean two rice fields rarely look identical.
- Mixed Information: A single polygon contains rice, duckweed, open water, and soil.
Existing Object-Oriented methods often fail because they treat the field as a homogenous object, whereas it is actually a heterogeneous "neighborhood." The authors' insight is grounded in Tobler's First Law of Geography: while the details vary, the ratio and spatial relationship of these components (base-units) remain statistically consistent across samples.
Methodology: From Base-Units to Knowledge Mining
The authors break down the extraction into a sophisticated three-step pipeline:
1. Identifying "Base-Units"
Rather than looking at pixels, the image is segmented into "base-units" using K-means. These units represent pure spectral clusters (e.g., "Clear Water," "Lush Rice," "Wet Soil").
2. Feature Vector Construction
Each rice field is defined by a comprehensive index () consisting of:
- Spectral Feature Vectors: Mean values across bands.
- Dominance (): The area ratio of each base-unit type.
- Aggregation Index (): A measure of how "clumped" or "scattered" the units are.
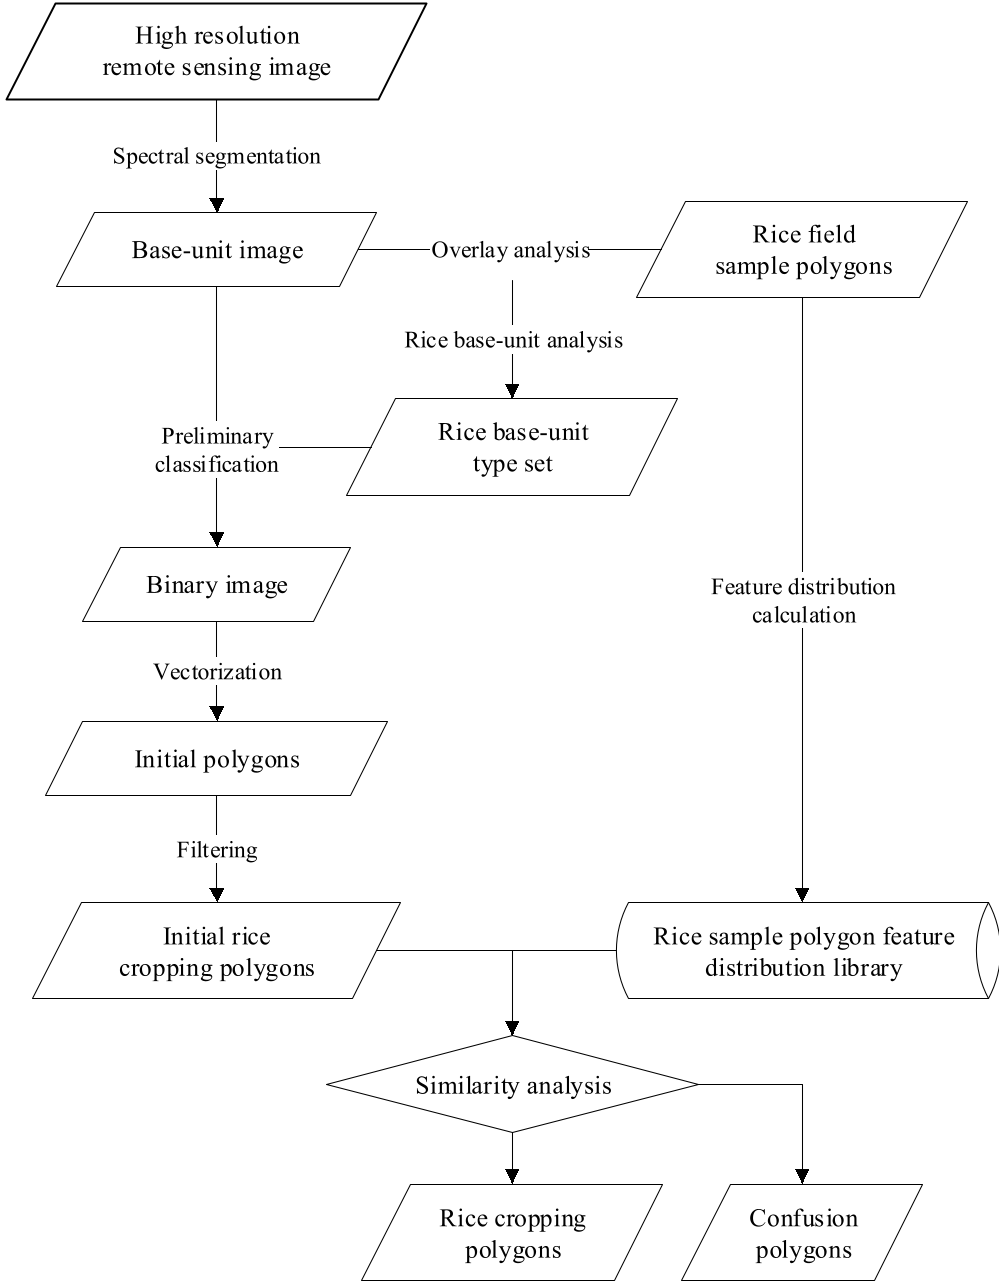 Fig 1: The overall technical workflow showing the transition from segmentation to similarity filtering.
3. Eliminating Confusion via EMD
The "Knowledge Mining" aspect comes from creating a library of these distributions from known samples. To compare a candidate polygon against the library, the authors use Earth Mover's Distance (EMD). This is crucial because EMD can compare distributions even if they don't share the exact same base-unit types, effectively measuring how much "work" it would take to turn one field's composition into another's.
Experiments & Results
The study focused on Zhejiang Province, characterized by fragmented, hilly cultivated land. Using GF-1 (2m) and GF-2 (0.8m) data, the method demonstrated remarkable precision:
| Metric | Result |
|---|---|
| Overall Accuracy | 96.77% |
| Kappa Coefficient | 0.94 |
| Producer's Accuracy (Rice) | 99.12% |
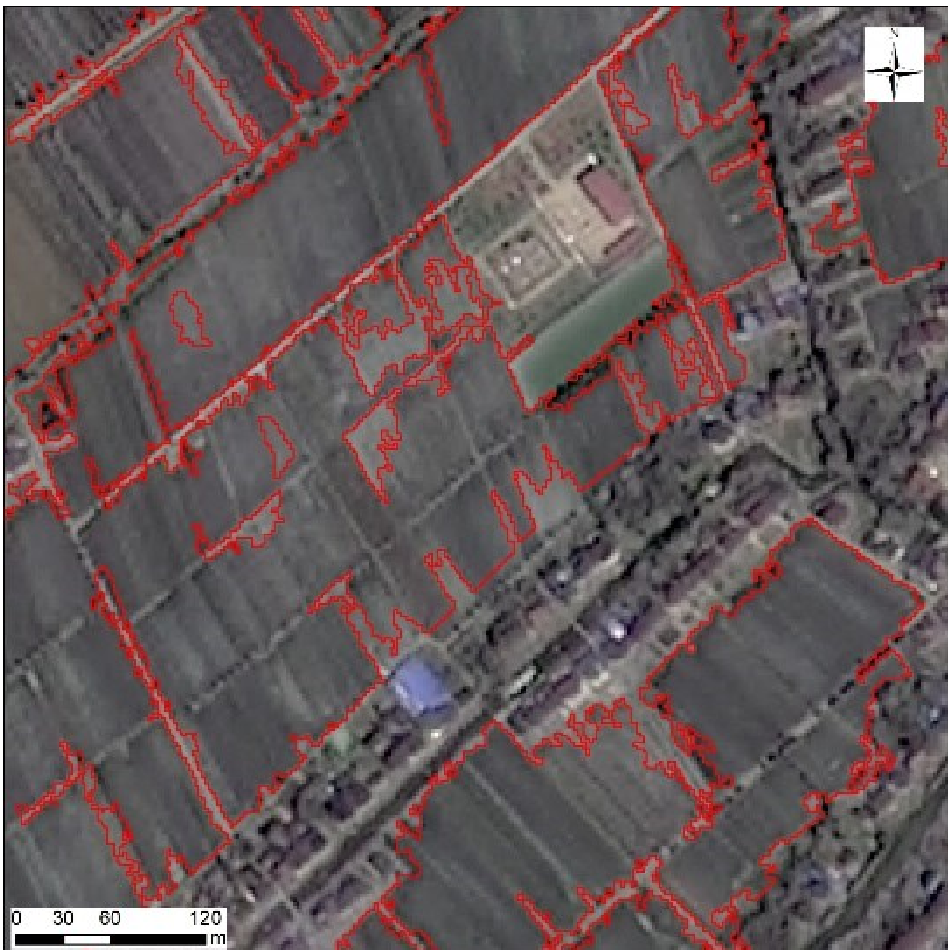 Fig 2: Visualization of base-unit types within a rice field, illustrating the diversity of spectral components.
The ablation of "confusing polygons" proved highly effective. Many non-rice areas initially flagged by spectral markers were successfully filtered out because their component ratios (the "recipe") didn't match the validated rice samples.
Critical Insight & Conclusion
The genius of this work lies in its move away from "What is this pixel?" to "Is this distribution typical of rice?"
Takeaways:
- Complexity is a Feature: Instead of trying to smooth out spectral heterogeneity, this method uses it as a fingerprint.
- Universal Applicability: While tested on rice, this framework of mining "component recipes" could be applied to any complex land cover (e.g., wetlands, urban residential zones).
- Limitations: The method relies heavily on the quality of the initial segmentation and the representativeness of the sample library. If a new rice cropping technique is used that significantly alters the base-unit ratios, the system requires re-training.
In the era of high-res satellite data, this research provides a vital bridge between low-level spectral data and high-level geographic knowledge.