
Characterizing Facebook: The Mathematical Blueprint of Social Connectivity and Fan Growth
Characterization of user networks in Facebook
This paper presents a measurement study of Facebook's structural characteristics, focusing on both the social graph of user profiles and the growth dynamics of fan pages. The authors identify that user node degrees follow a Lognormal distribution, while the daily increase in fans for "Walled Garden" web pages follows a Weibull distribution.
TL;DR
This seminal 2010 study dives into the structural DNA of Facebook, revealing that user friendships are not randomly distributed but follow a Lognormal distribution. Furthermore, the way "fandom" spreads—specifically the increase in page fans—adheres to the Weibull distribution. These findings provided a foundational framework for understanding how information and social ties scale in the Web 2.0 era.
Background & Motivation: Beyond the Hype
By 2010, Facebook had transitioned from a campus directory to a global marketing powerhouse. While users saw photos and status updates, network providers saw massive, unpredictable traffic spikes. The authors, Pakzad and Abhari, recognized a gap: while Facebook applications had been studied, the underlying user-to-user network and the brand-to-fan dynamics lacked rigorous mathematical characterization.
The motivation was clear: if we can model the "degree" (number of friends) and the "fan growth rate," we can predict everything from server load to the viral trajectory of a marketing campaign.
Methodology: Crawling the Social Graph
The researchers faced a significant challenge—Facebook's "Walled Garden" privacy settings. To circumvent this, they utilized:
- BFS Crawling: Twenty fake profiles were joined to diverse regional networks (Sweden, India, New York) to perform a Breadth-First Search of accessible friendship lists.
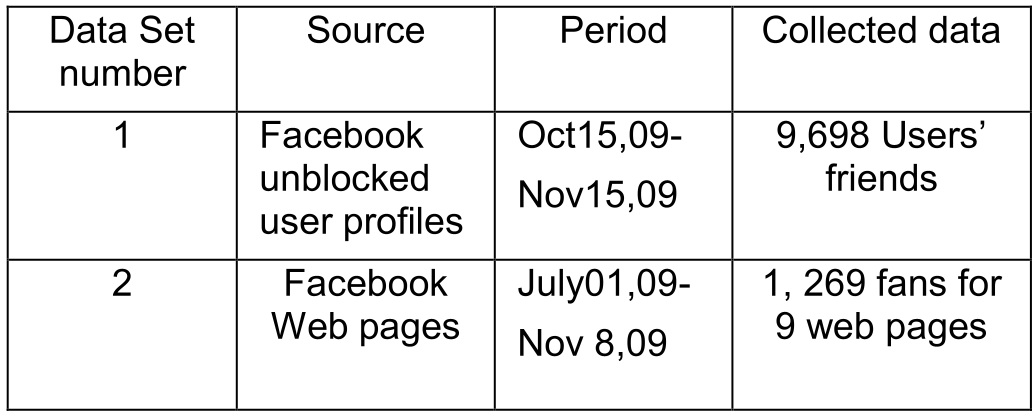
- Breadth vs. Depth: They collected data on nearly 10,000 users, treating each friendship as an undirected link in a massive graph.
- Temporal Tracking: For 131 days, they manually tracked the fan counts of major entities like Starbucks, CNN, and Oprah to capture the "pulse" of digital popularity.
Core Insight 1: Why Your Friend List is "Lognormal"
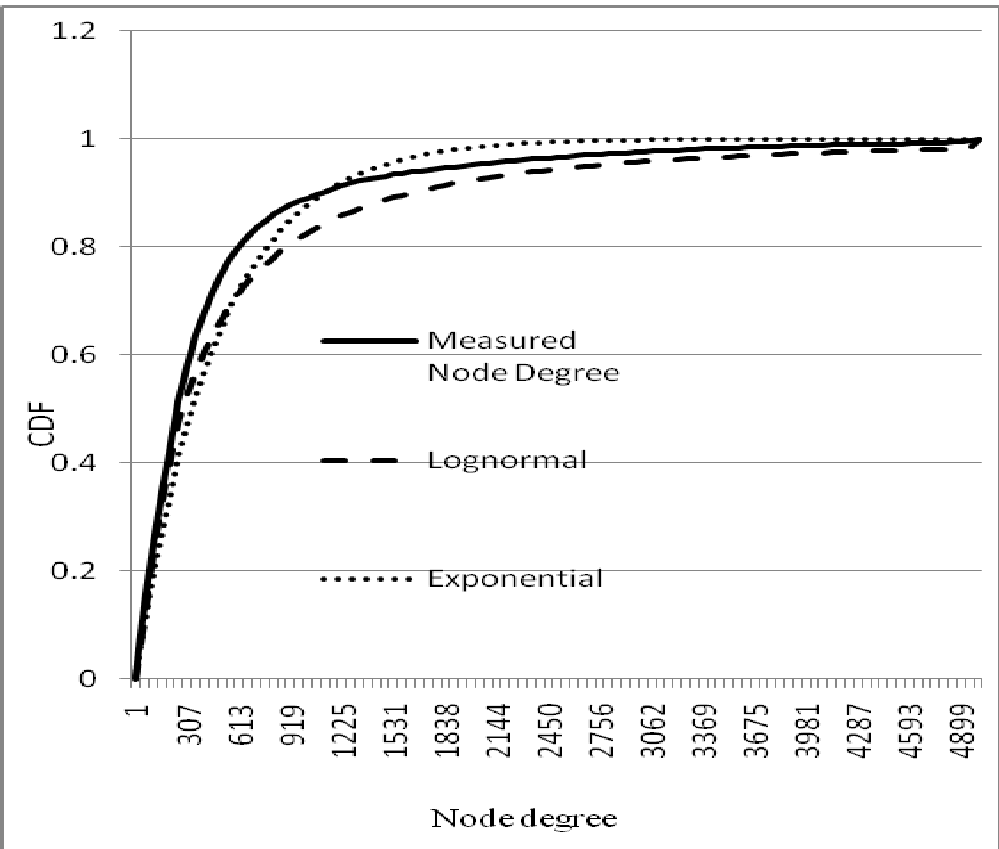
In many networks, researchers expect a "Power Law" (where a few superstars have millions of links). However, this study found that Facebook's node degree fits a Lognormal distribution more closely.
The Kolmogorov-Smirnov (K-S) test confirmed this, showing a much lower error rate for Lognormal (0.054) than Exponential (0.116). This suggests that social growth on Facebook is a multiplicative process—your probability of gaining new friends is proportional to the friends you already have, but limited by human social capacity.
Core Insight 2: The Weibull Nature of Viral Growth
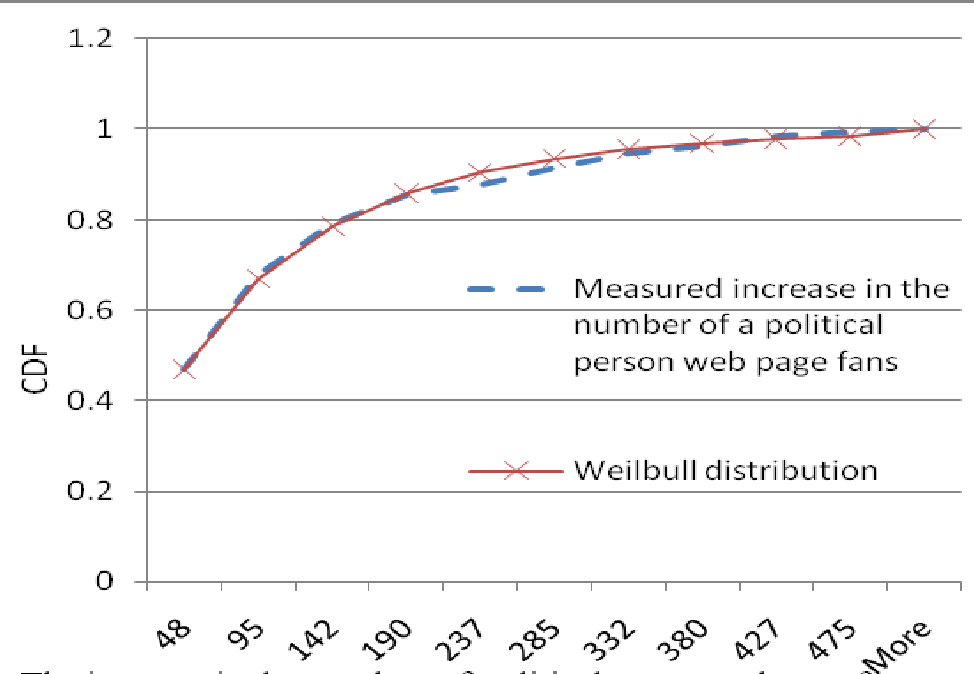
When looking at how pages like Starbucks or CNN grow, the "daily increase" in fans was the key metric. The study found that this growth consistently followed the Weibull distribution, a model often used in reliability engineering to describe "failure" or "arrival" rates.
Whether it was a political figure or a coffee brand, the CDF (Cumulative Distribution Function) showed a distinct curve that the Weibull model captured perfectly. This indicates that fan growth has a "memory"—the rate of new fans joining today is intrinsically linked to the current lifecycle of the brand's visibility on the platform.
Critical Analysis & Takeaways
- Small World, Big Impact: The study reinforces the "Small World Phenomenon," where any two users are linked by a surprisingly short path, facilitating the rapid spread of news.
- Marketing Utility: By identifying the Weibull pattern, companies could (even in 2010) better estimate the ROI and "saturation point" of their social media presence.
- Limitations: The dataset (approx. 10k users) is a tiny snapshot of Facebook’s total billions. Additionally, the BFS method is inherently biased toward "unblocked" or public-facing profiles, potentially overlooking more private clusters of the social graph.
Future Outlook
Today, as we move into the era of AI-driven feeds (TikTok), the traditional "friendship graph" is being replaced by the "interest graph." However, the mathematical foundations laid in this paper—identifying the distributions that govern human digital interaction—remain essential for anyone building the next generation of social technology.