
Quantifying the Invisible: A Community-Based Approach to Facebook Vulnerability
Analysis of vulnerability to facebook users
This paper introduces a quantitative framework to evaluate user privacy risks on Facebook by proposing a composite "Vulnerability Indicator." The method categorizes users into four risk levels (Low, Medium, High, Very High) based on an exposure index derived from personal data volume and network size, validated through a study of 75,000 active profiles.
TL;DR
In the era of "oversharing," how do we measure the actual risk of a Facebook profile? This paper proposes a mathematical indicator that combines the rarity of information shared with the breadth of a user's social circle. By analyzing 75,000 real-world profiles, the researchers provide a roadmap for "Privacy Labels" that could warn users when their exposure exceeds the community norm.
Background: The Paradox of Sharing
Social networking thrives on the tension between connection and protection. Most users (up to 98% in this study) never touch their default privacy settings, yet they voluntarily populate fields that make them targets for phishing, spam, and identity theft. The authors position this work as a bridge between abstract privacy concerns and actionable security metrics.
The "Physical Intuition" of Exposure
The core logic of this paper rests on a simple but powerful intuition: Exposure = Data Sensitivity × Reach.
- Inverse Popularity Weighting: If everyone shares their "City," sharing your city isn't a high-risk act—it's a community norm. However, if only 0.4% share their "Home Address," that attribute is highly identifying and carries a massive weight in the vulnerability score.
- The Friend Multiplier: Every friend is a potential "leak point." The authors normalize the data weight against the maximum possible friends (5,000 on Facebook) to capture the scale of potential dissemination.
Methodology: Calculating the Exposure Index
The researchers define the Exposure Index () as:
Where:
- : Current friend count.
- : The 5,000 friend limit.
- : The weight of attribute (inverse to its 0–1 frequency).
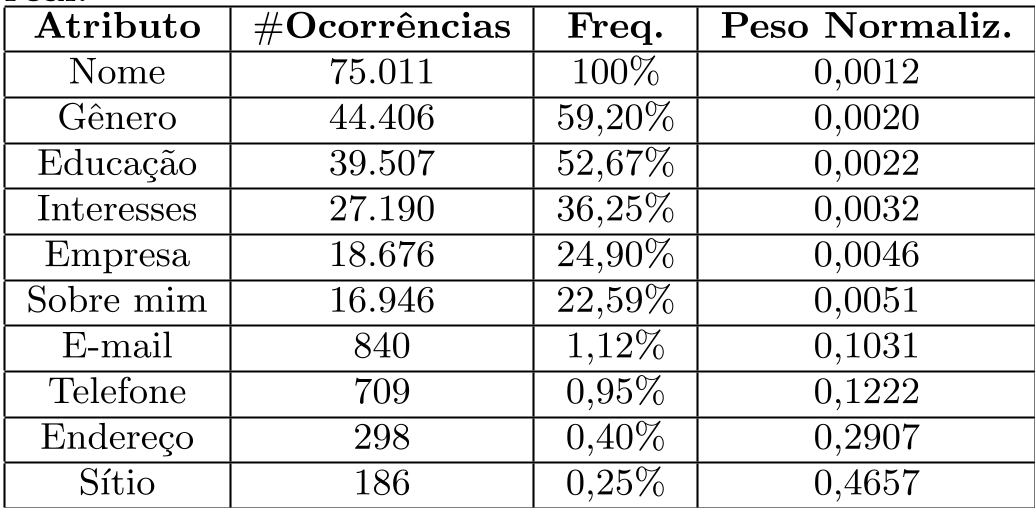 Table: Weighted attributes showing that rarer data like "Sítio" (Website) and "Endereço" (Address) have significantly higher normalized weights.
Experimental Insights: The 5,000-Friend Ceiling
The study analyzed 75,011 active profiles. Interestingly, the distribution of friends showed a "double peak" behavior. While most users maintained modest networks (250–500 friends), a significant spike occurred at the 4,500–5,000 mark.
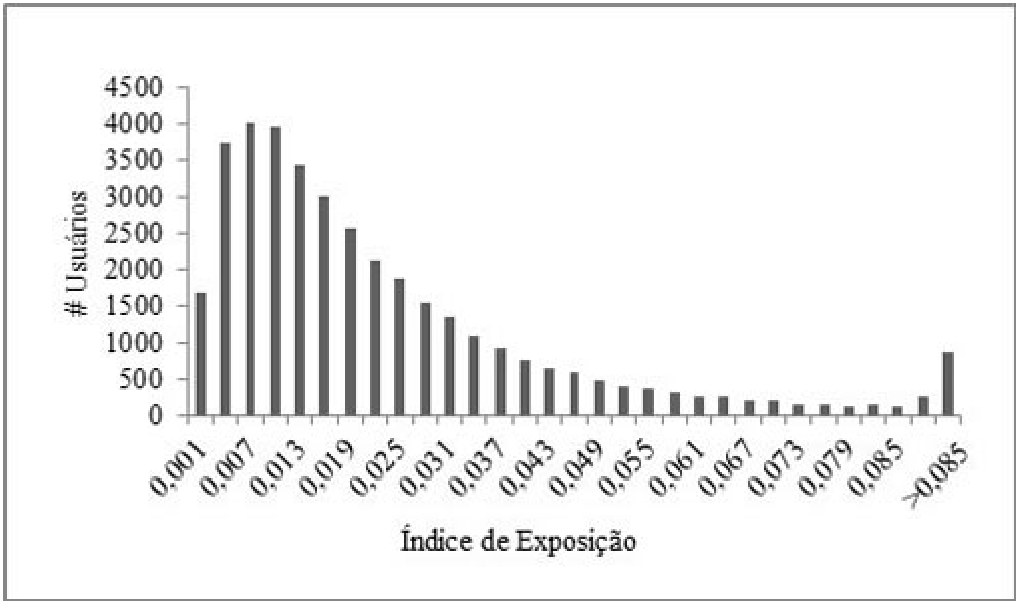 Figure: The "inflexion" point near the system limit suggests a specific class of "Power Users" or "Spammers" who maximize their reach regardless of privacy.
Qualitative Risk Mapping
Rather than just giving a raw number (e.g., "0.085"), the authors used a derivative-based approach and K-Means Clustering to divide users into four sensible risk categories.
- Low (0.000 - 0.010): 94.37% of the population. These users share the "basics" (Name, Gender) but have restricted circles.
- Very High (0.085 - 1.000): The "Exhibitionists." These users have both high data transparency and massive friend lists, representing the primary targets for large-scale data harvesting.
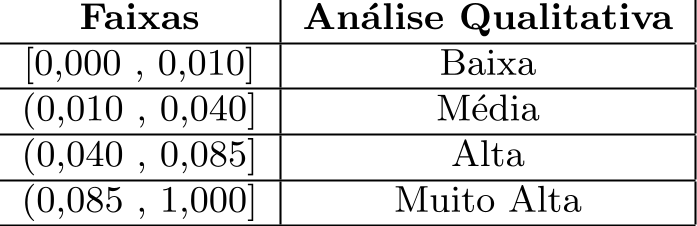 Table: Categorization of risk based on the Exposure Index.
Critical Analysis & Future Outlook
The beauty of this framework is its Community-Sourced Sensitivity. Instead of an expert deciding what is "secret," the community’s behavior defines the risk. If a community becomes more secretive about "Education," the metric automatically updates to reflect that shift.
Limitations: The 2012 study focused on static profile fields. In today's landscape, unstructured data (wall posts, photo tags, and AI-driven facial recognition) represents a much larger attack surface. Modern adaptations of this index would need to incorporate NLP to weight the sensitivity of post content.
Future Impact: The authors suggest integrating this indicator into the UI. Imagine a "Privacy Thermometer" on your profile: adding a suspicious friend with high global exposure might push your meter into the "Red Zone," prompting you to reconsider. This turns privacy from a legal document into a real-time user experience.