
Decoding Digital Generations: Behavioral Disparities Between Young and Older Facebook Users
An Examination of the Behaviour of Young and Older Users of Facebook
This paper presents a comparative analysis of Facebook user behavior across two distinct age demographics: young (15-30) and older (50+) users. By developing a Social Network Interaction Analysis (SNIA) framework, the authors quantify activity frequencies and visualize longitudinal engagement patterns to distinguish digital natives from older adopters.
TL;DR
Is age just a number, or does it dictate your digital footprint? This study performs a deep dive into Facebook "Wall" interactions, revealing that while younger users are frequent, consistent contributors, over half of older users remain "silent observers." By quantifying these interactions, the research opens the door to using social media activity as a tool for monitoring mental well-being and social engagement.
Background & Positioning
In the landscape of 2011, social media was transitioning from a niche novelty to a global footprint. While most researchers were obsessed with "Graph Theory" and how people were connected (the what), Quinn et al. shifted the lens toward Social Network Interaction Analysis (SNIA)—the how and when. This work serves as a foundational empirical study comparing generational "modality of use," moving beyond structural maps to understand the heartbeat of individual activity.
The Core Challenge: Quantifying Engagement
The researchers identified a major gap in Social Network Analysis (SNA): we knew who was in the network, but we didn't know the pace of their digital life. The challenge was twofold:
- Privacy Barriers: Much of the data is locked behind "Friends-only" walls.
- Normalization: How do you compare a user who has been on Facebook for three years with one who joined three months ago?
The authors solved this by focusing on publicly available "Everyone" profiles and deriving a simple yet effective Activity Frequency (af) formula: Where is the total activities and is the duration of the active period. This normalized the "density" of a user's presence.
Methodology: The "Wall" as a Chronicle
The researchers harvested data from 500 profiles (equally split by age and gender). They focused specifically on User Comments and User Replies, excluding non-user generated content to ensure the data reflected the individual's own "social energy."
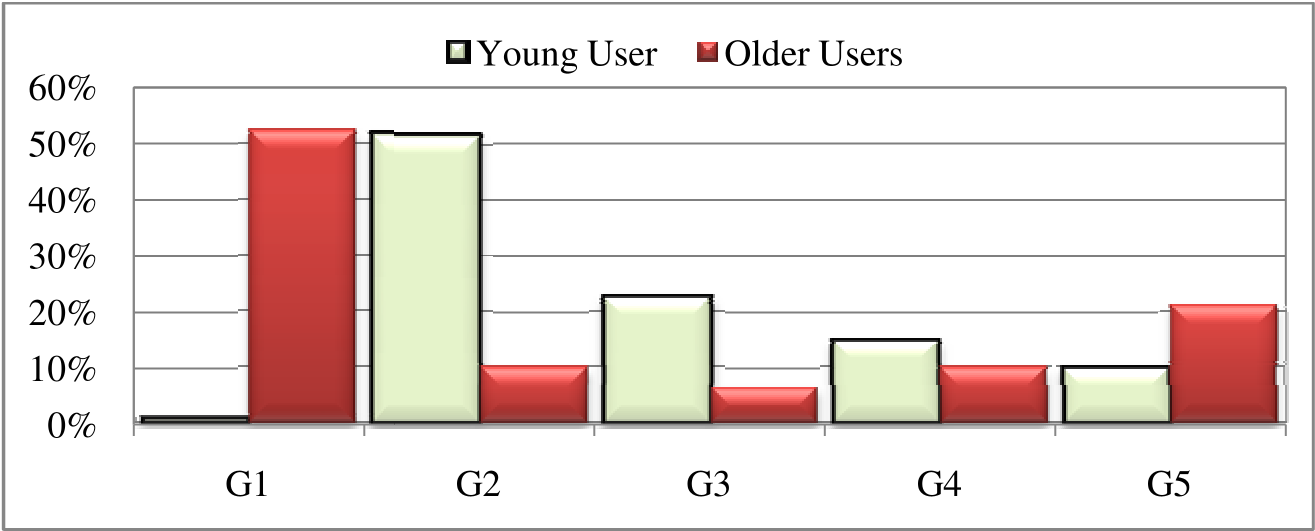 Fig 1 & 2: Comparison of Comment and Reply Frequencies between cohorts.
Key Insights: The Generational Divide
The findings revealed a stark "Digital Participation Gap":
- The Silent Majority: 52% of older users occupied the G1 (Zero Activity) category. They are members of the network but treat it as a passive consumption medium.
- The Consistent Youth: Younger users were almost never inactive (only 1% in G1). Over half of them maintained a steady, high-frequency presence.
- The Active Minority: Interestingly, in the "Over 20 days" (G5) extremely active category, older users who were active tended to stay highly active (21%), suggesting that once older users cross the adoption threshold, they can become power users.
Visualizing the Lifestyle
By plotting the activity of a "representative user" over a year, the authors identified that activity isn't random—it clusters.
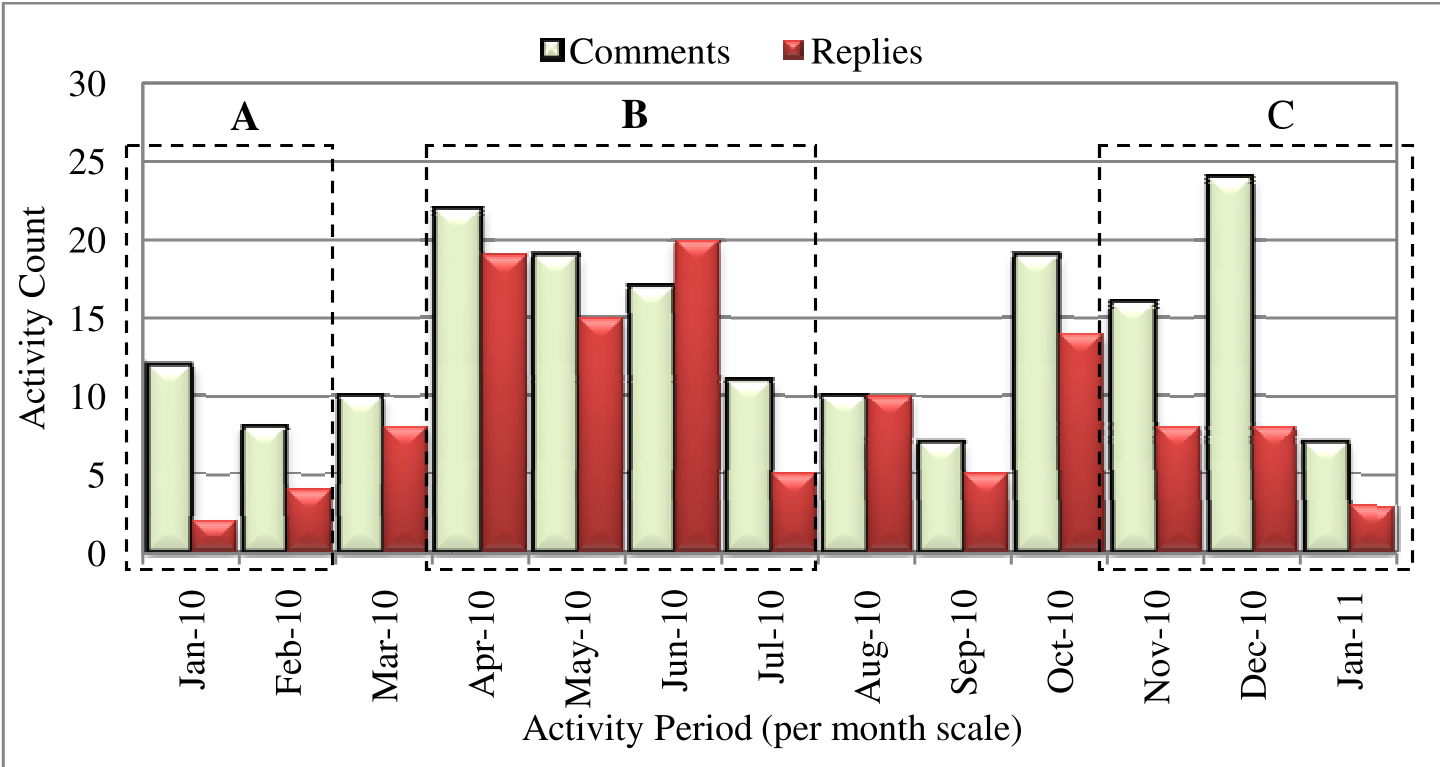 Fig 3: Longitudinal visualization of a younger user showing periods of "High" and "Non-engagement".
The visualization identified three distinct bands:
- Band A: Early engagement/Exploration.
- Band B: Heightened activity (likely linked to real-world events like holidays).
- Band C: Stable, current behavior.
Critical Perspective: Beyond the Data
The true value of this paper lies in its Predictive Potential. The authors hypothesize that these "Digital Pulses" could be used in Epidemiology. If a user's frequency suddenly drops from a G5 to a G1, it could serve as an early warning for social isolation, depression, or physical illness—particularly in vulnerable older populations.
Limitations
- Selection Bias: By only looking at "Public" profiles, the study may be looking at a specific subset of personality types (likely more extroverted).
- Data Recency: As Facebook's UI and features (like "Reactions" or "Stories") evolved, the metrics of "Comments" and "Replies" became just a small part of the interaction story.
Conclusion
Quinn et al. successfully quantified the "digital divide" not just by who has an account, but by how they use it. The study reinforces the idea that younger users treat social networks as a constant stream of consciousness, while older users engage with a "binary" behavior—either completely inactive or intensely involved. For future researchers, the focus moves toward correlating these activity spikes with psychological well-being.