
Deciphering Urban Vitality: Transforming Tweets into Real-Time Land-Use Intelligence
Facility detection and popularity assessment from text classification of social media and crowdsourced data
This paper presents a framework for real-time facility detection and popularity assessment (e.g., restaurants, airports, stadiums) using text classification of geotagged Twitter data. By employing NLP and machine learning (SVM/Naïve Bayes), the authors identify if a user is physically present at a location, achieving up to 93.2% accuracy and 98.7% peak precision.
TL;DR
Researchers at Oak Ridge National Laboratory have developed a method to detect facility usage (restaurants, airports, stadiums) by analyzing the unstructured text of tweets rather than relying on explicit check-ins. By using SVM and Naïve Bayes classifiers on TF-IDF vectors, they achieved up to 98.7% precision, turning social media into a high-fidelity sensor for urban dynamics.
Background: The Limits of Static Geography
Historically, urban planners have relied on Census data or travel surveys to understand how people move. The problem? This data is static (updated every few years) and coarse. While Call Detail Records (CDR) from mobile towers offered a leap forward, they lacked "semantic context"—a cell tower can tell you someone is in a city block, but it can't tell you if they are in the apartment on the 5th floor or the restaurant on the ground floor.
The authors of this paper argue that the answer lies in the words we type. By shifting from "where the signal is" to "what the user is saying," we can disaggregate commercial land use into specific facility types.
Methodology: From Unstructured Text to Spatial Insight
The core challenge is noise. A tweet containing the word "airport" doesn't mean the user is at an airport (e.g., "I hate airport security" tweeted from home). To solve this, the authors built a pipeline focused on presence-verification classification.
- Data Harvesting: Using the PlanetSense architecture, they collected millions of tweets globally via the Twitter Streaming API.
- NLP Preprocessing: They used Stanford CoreNLP for tokenization and lemmatization, stripping hashtags and normalizing handles (e.g., converting "@" to "at") to maintain linguistic structure.
- Feature Engineering: Tweets were converted into TF-IDF (Term Frequency-Inverse Document Frequency) vectors. This statistical measure highlights "important" words that signal presence (like "waiting," "boarding," or "delicious") while downweighting common noise.
- Classification: They compared Naïve Bayes (fast, independent features) with Support Vector Machines (SVM) (robust in high-dimensional space).
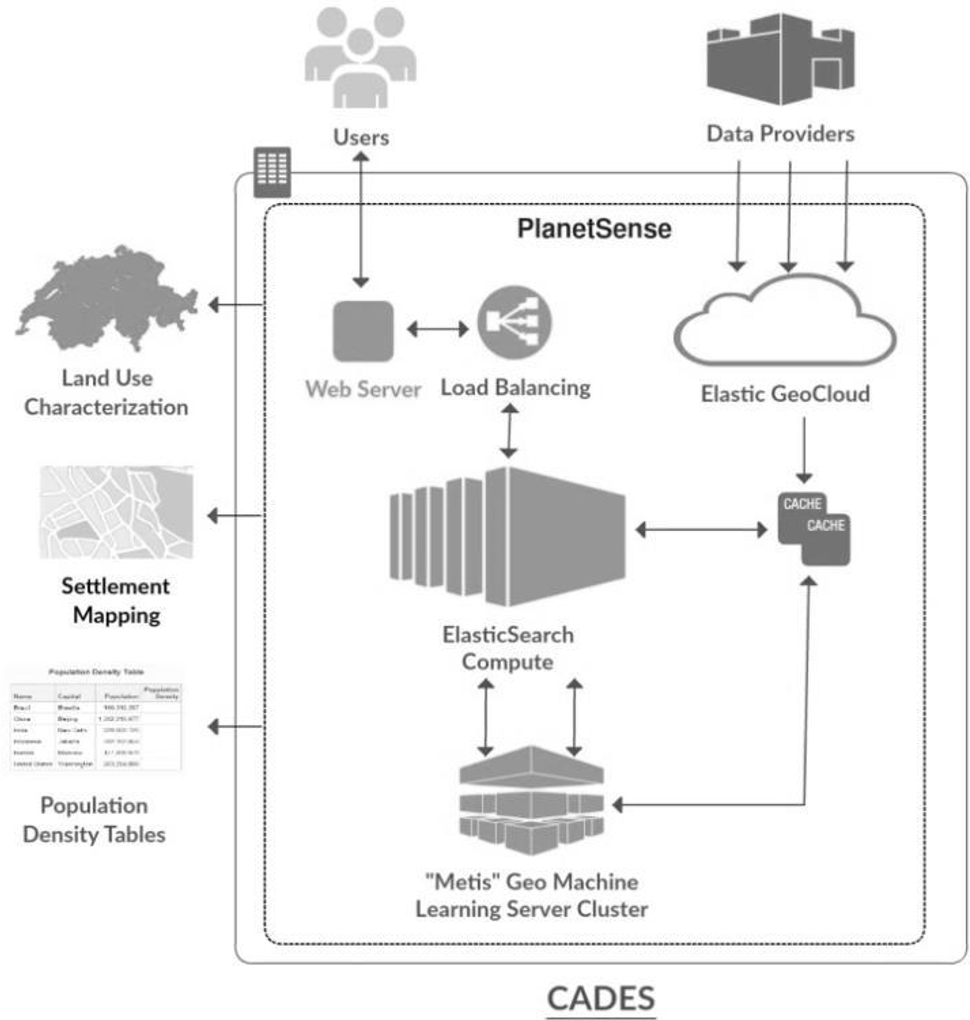 Figure 1: The PlanetSense architecture used to ingest and process global social media streams.
Experimental Results: Precision is King
The study focused on three categories: Restaurants, Airports, and Stadiums.
- Restaurants: The star performer. SVM achieved 93.2% accuracy and a staggering 98.7% precision. The authors attribute this to the specific, shorter-duration nature of restaurant visits, which produces more predictable language.
- Airports & Stadiums: These saw slightly lower accuracies (~82-85%). The complexity of these environments (long layovers, diverse activities) leads to a wider variance in tweet content, making classification harder.
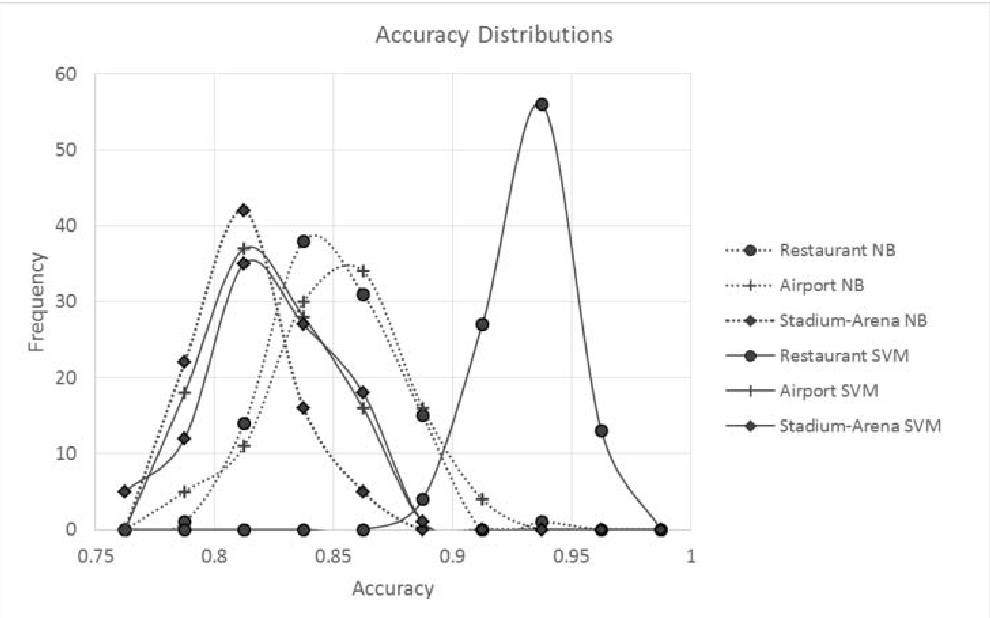 Table 1: SVM outperformed Naïve Bayes in most categories, particularly in precision—crucial for avoiding "False Positives" in population mapping.
The researchers emphasized Precision over Accuracy. In urban modeling, it is better to ignore a valid tweet (False Negative) than to incorrectly place a person at a stadium when they are actually just watching the game on TV (False Positive).
Critical Analysis & Future Outlook
While the study is a breakthrough in using unstructured data, it has limitations:
- Keyword Dependency: The current model relies on the specific words "restaurant," "airport," or "stadium" appearing in the tweet. Future iterations could use semantic embeddings (like BERT or modern LLMs) to identify facilities even when the specific keyword is absent (e.g., "Enjoying this steak at Morton's").
- Demographic Bias: Twitter users are not a perfect proxy for the general population.
The Takeaway: This work bridges the gap between natural language processing and geographic information systems (GIS). It transforms "social noise" into a "participatory sensing" network, allowing for the generation of dynamic occupancy curves that could revolutionize how we manage energy consumption and urban traffic in real-time.
Main Contribution: A validated NLP pipeline that proves unstructured social media text can replace or augment explicit check-in data for high-precision facility popularity tracking.