
FASSSTrace: Leveraging Micro and Macro Social Network Analysis to Decode Pandemic Transmission
FASSSTrace: Embedding Micro and Macro Social Network Analysis in Modeling Contact Tracing during the Early Stages of the Pandemic
This paper introduces FASSSTrace, a digital contact tracing model that utilizes two-mode Social Network Analysis (SNA) to map COVID-19 transmission. By integrating both individuals and geographical locations as nodes, it achieves a high-fidelity visualization of superspreading dynamics and transmission patterns across different pandemic phases in the Philippines.
TL;DR
The FASSSTrace study presents a sophisticated digital framework for contact tracing that moves beyond simple person-to-person tracking. By employing Social Network Analysis (SNA) and treating geographical locations as active nodes in a "two-mode network," the researchers identified the structural dynamics of COVID-19 spread in the Philippines. The model successfully pinpointed superspreaders and "bridging" locations, showing a dramatic 125% expansion in the network's reach as lockdown measures loosened.
Problem & Motivation: The Flaw in Homogeneous Mixing
Most traditional pandemic models use compartmental logic (like SIR) which assumes every individual has an equal chance of meeting any other individual. In reality, human interaction is heterogeneous.
The authors identified two critical gaps:
- Manual Inefficiency: Traditional tracing cannot keep pace with the exponential growth of an outbreak.
- Location Blindness: Standard tracing often ignores that two unlinked cases might be connected by a shared visit to a specific workplace or hospital—the "indirect transmission" route.
Methodology: The Two-Mode Network Approach
The core innovation of FASSSTrace is the Two-Mode Network. Instead of just mapping Person A to Person B, the model maps:
- Person-to-Person: Direct yellow-line contacts.
- Person-to-Location: Connecting individuals to blue (hospitals), green (households), or red (workplaces) nodes.
Architecture and Visualization
The researchers categorized the analysis into two scopes:
- Micro-level: Calculating Degree Centrality (to find superspreaders) and Betweenness Centrality (to find "bridges" between different social circles).
- Macro-level: Tracking the Network Diameter and Clustering Coefficient to see how fast the "infectivity range" of the whole city is growing.
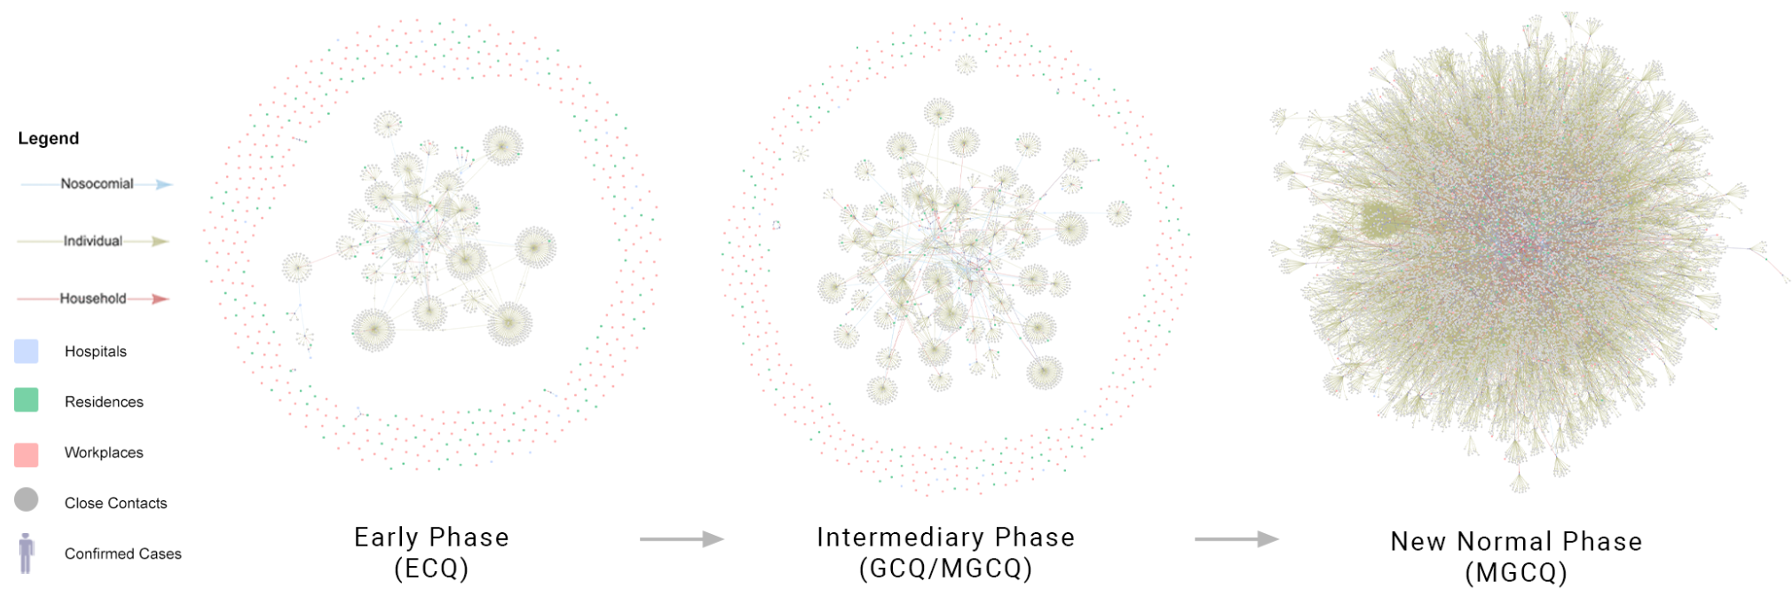 Figure 1: Evolution of the contact network from the restrictive Early Phase to the expanded New Normal Phase.
Experiments & Results: Mapping the Surge
The study analyzed three distinct phases: Early (ECQ), Intermediary (GCQ), and New Normal (MGCQ).
1. The Expansion of Transmission
The data revealed a stark reality: as the community quarantine moved from ECQ to MGCQ, the Network Diameter expanded from 8 to 18. This suggests that the "longest chain" of transmission more than doubled, significantly increasing the difficulty of containment.
2. The 4% Rule
The Static Analysis yielded a critical insight for policy makers: only 4.11% of the total nodes were responsible for the majority of the transmission. These "superspreading" nodes were most frequently linked to workplaces and hospitals, rather than general social gatherings.
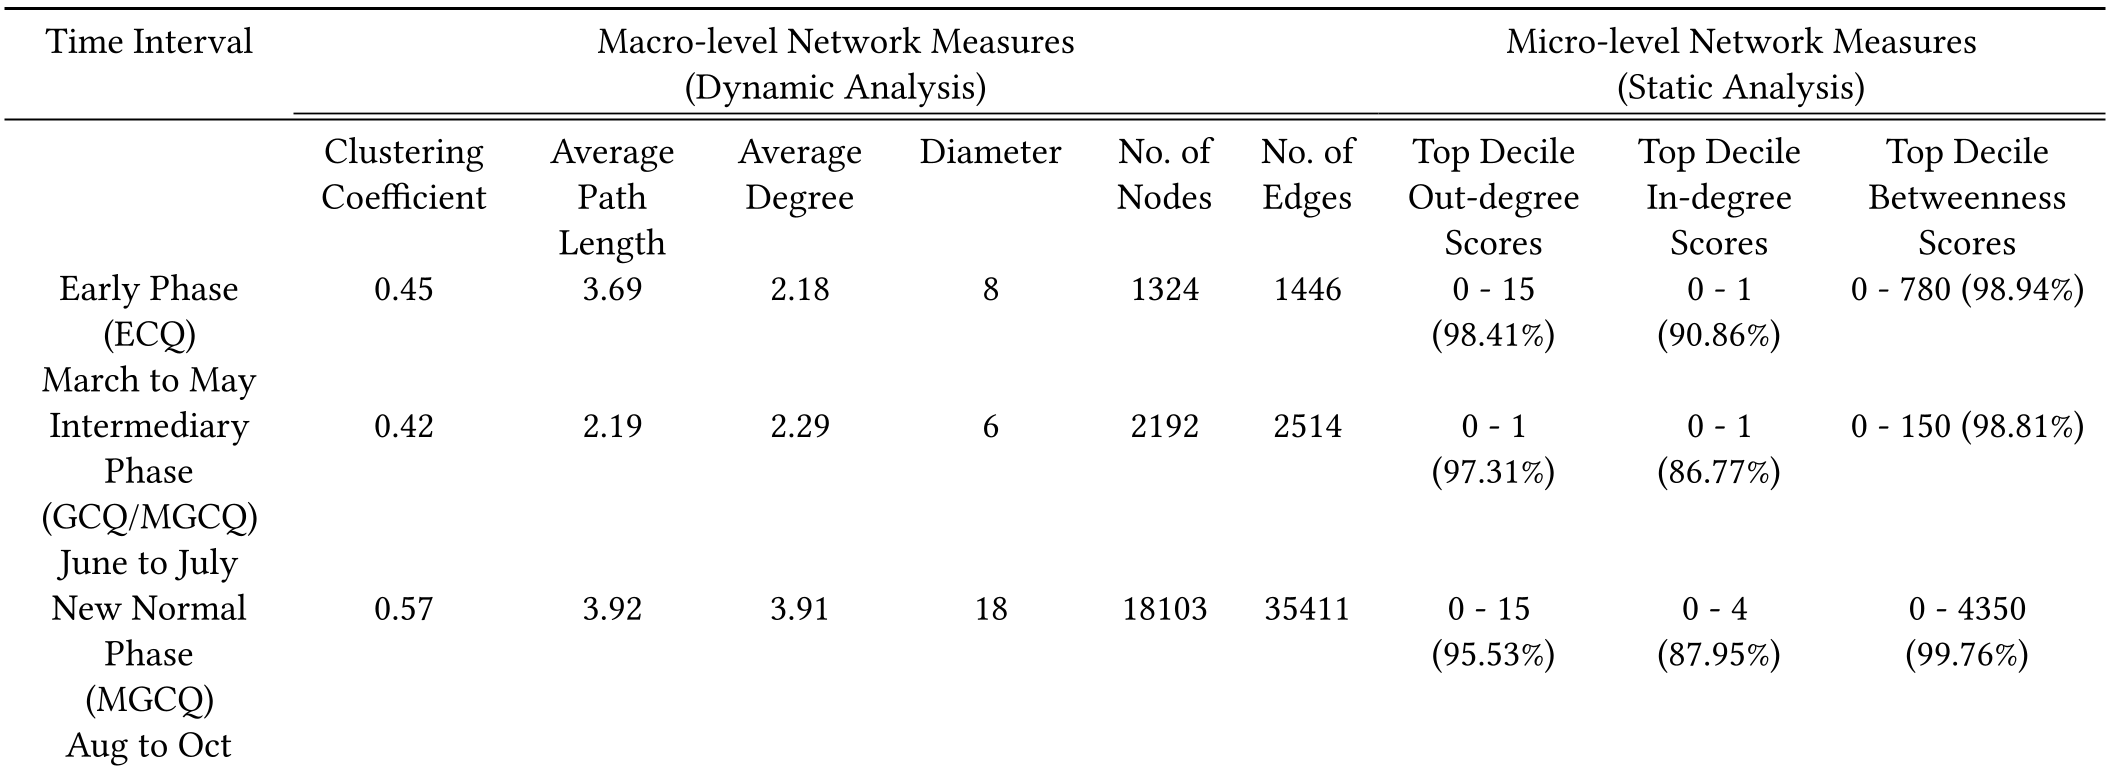 Table 1: Macro-level indicators showing the sharp increase in Average Degree and Diameter during the New Normal phase.
3. Centrality Metrics
By using log-scale histograms (Figure 2), the authors proved that "In-degree" (exposure) was low for most people, but "Out-degree" (spreading) was highly concentrated in a few individuals and locations.
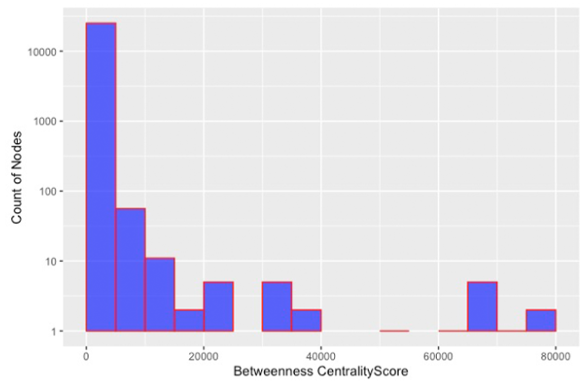 Figure 2: Distribution of centrality scores, highlighting the heterogeneous nature of the outbreak.
Critical Analysis & Conclusion
Takeaways
FASSSTrace proves that SNA is a force multiplier for local health units. By focusing resources on high-betweenness individuals (the "bridges") and high-out-degree locations (the "hubs"), authorities can break the transmission chain more effectively than with blanket lockdowns.
Limitations & Future Work
The study relies on "partially de-identified" recorded data, which may suffer from reporting bias (i.e., people forgetting where they went). A logical next step is the integration of automated digital check-ins to feed the two-mode network in real-time, allowing for "proactive" rather than "reactive" tracing.
Ultimately, this work underscores that in the race against a pandemic, understanding the structure of the network is just as important as understanding the biology of the virus.