
Beyond Heatmaps: Decoding Player Psychology via Feature-Based Projections
Feature-based projections for effective playtrace analysis
The paper introduces an enhanced version of "Playtracer," a visual data mining tool that utilizes feature-based projections to analyze player behavior. By collapsing large or continuous state spaces into discrete, meaningful features, the method enables effective analysis of complex games like Refraction, Hello Worlds, and Foldit.
TL;DR
Analyzing thousands of player replays is a monumental headache because raw game data is too "noisy" to reveal strategy. This paper presents an upgraded Playtracer that uses feature-based projections to simplify complex, continuous game states into intuitive maps. By focusing on what players mean (features) rather than exactly where they clicked (raw data), designers can finally spot exactly why players quit or how they solve puzzles.
Background: The Curse of Dimensionality in Playtesting
In the early 2010s, heatmaps were the gold standard for game analytics—showing where players died in Halo or Team Fortress 2. However, heatmaps fail for puzzle games or abstract games without a 2D map. The original Playtracer attempted to solve this by treating every game state as a node in a graph.
The Problem: If a game has continuous movement or millions of possible configurations (like Foldit), the graph becomes a "hairball" of nodes. This paper argues that we don't need to see every pixel; we need to see the features that define a player's progress.
Methodology: The Power of State Features
The core innovation is the Feature-Based Projection. Instead of mapping the raw state , the system maps a projection .
1. Discretization of the Infinite
In a continuous platformer like Hello Worlds, a player might be at . Mapping every pixel coordinate creates infinite states. By defining "Progress Regions" (boxes in the level), the authors collapse all coordinates within a box into a single conceptual state.
2. Semantic Aggregation
In the puzzle game Refraction, the authors used "Fringe Laser Strengths" as a feature. It doesn't matter how a player made a 1/6 laser; if they have a 1/6 laser near the goal, they are in the same "logical" state.
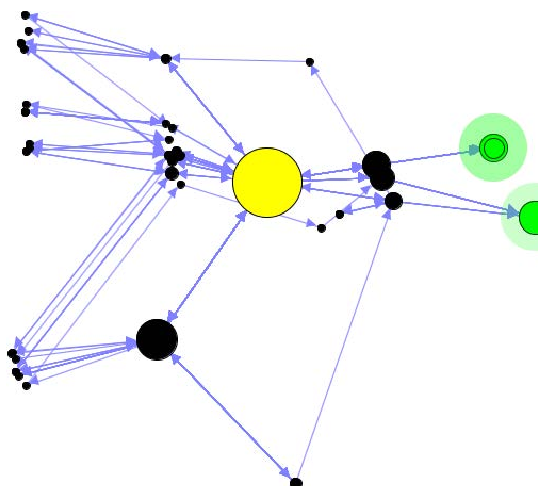 Figure 1: The MDS algorithm layout. Larger nodes represent states where more players spent time, and the distance represents how "far" states are from the goal/solution.
Experiments & Case Studies
Case Study 1: The "Optional Reward" Trap
Using Playtracer on Refraction, the team found a shocking result: adding optional coins made players quit more.
- The Discovery: The visualization showed that players with coins were "stuck" in a specific region of the state space (Region A) trying to solve a much more complex mathematical problem required for the coin, whereas players without coins took the "Easy Path" (Region B) and finished the level.
Case Study 2: Identifying the "Aha!" Moment
In Hello Worlds, the tool identified a specific "Aha!" state.
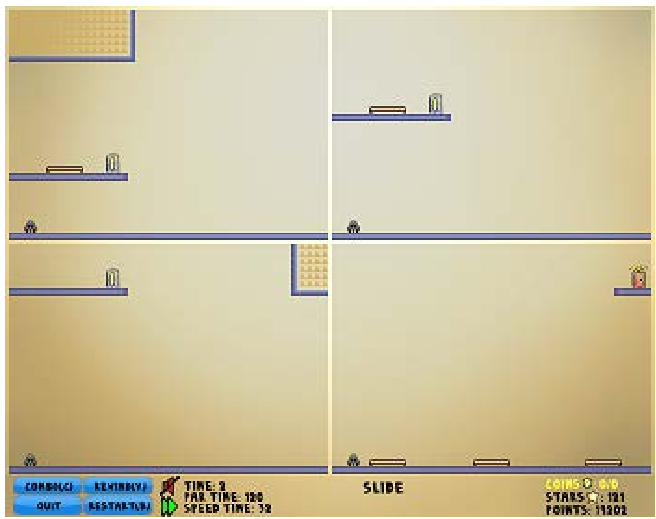 Figure 2: Once players reached this specific state (sliding the platform to clear the door), their probability of completing the level jumped significantly. This allows designers to see exactly where "learning" happens.
Case Study 3: The Frustration of Foldit
Analysis of the protein-folding game Foldit showed that "losers" weren't lost—they actually found the correct high-level protein structure but gave up because they couldn't optimize the final score. This suggested that the game needed better automated optimization tools rather than more tutorials.
Strategic Design Principles
The authors conclude with three mandates for feature selection:
- High-Level for Clarity: Use abstract features (like "Goal Distance") to clean up the map.
- Conceptual Equality: If two states feel the same to a player, they must be represented as the same feature value.
- Parsimony: Only add features that solve the specific question (e.g., don't track "coin collection" if you only care about "puzzle logic").
Critical Insight: The Future of Playtracing
This work shifted the focus from Tracking (what happened) to Modeling (what it means). For modern researchers, the next step is automating this process—using AI to "discover" these features without a human designer having to manually define "progress regions."
Takeaway: If your player data looks like noise, it's because you're looking at the wrong dimensions. Feature-based projection is the filter that turns raw telemetry into design wisdom.