
Decoding Financing Trade: A Machine Learning Approach to Economic Pattern Recognition
Exploring the financial indicators to improve the pattern recognition of economic data based on machine learning
This paper develops a machine learning-based pattern recognition framework to identify "financing trade" activities among listed companies. By integrating Principal Component Analysis (PCA) with K-Nearest Neighbors (KNN) and Support Vector Machines (SVM), the authors achieve a diagnostic accuracy exceeding 95% in detecting anomalous financial patterns.
TL;DR
In the high-stakes world of corporate finance, identifying "financing trade" (complex circular trading used to inflate balance sheets) is often like finding a needle in a haystack. This paper presents a robust data mining framework that leverages Principal Component Analysis (PCA) and Machine Learning (KNN/SVM) to identify these patterns with over 95% accuracy, highlighting critical indicators like accounts receivable and taxes payable as the primary "smoking guns."
The Core Challenge: Noise and Subjectivity
Domestic securities markets have long relied on fundamental analysis. However, as financial markets evolve into complex systems, subjective judgment becomes a bottleneck. The researchers point out that:
- Non-linearity: Information impact on market trends is rarely a straight line.
- Dimensionality: With hundreds of financial indicators released in quarterly reports, human analysts often ignore hidden correlations.
- Subjectivity: Traditional "rules of thumb" fail when the "rules of the game" change.
Methodology: From High-Dimensional Chaos to Clean Features
The authors propose a multi-stage pipeline to process data from listed companies (2010-2019).
1. Dimensionality Reduction (PCA)
Financial data is notoriously redundant. For instance, tax payable and gross profit often move in tandem. The paper utilizes PCA to transform related variables into uncorrelated "Principal Components."
- Insight: By maintaining an 80-85% cumulative variance contribution rate, the model retains the essence of the company's financial health while stripping away redundant noise.
2. The Neural Network & Classifier Architecture
The architecture relies on a Backpropagation (BP) Neural Network using a multi-layer perceptron structure.
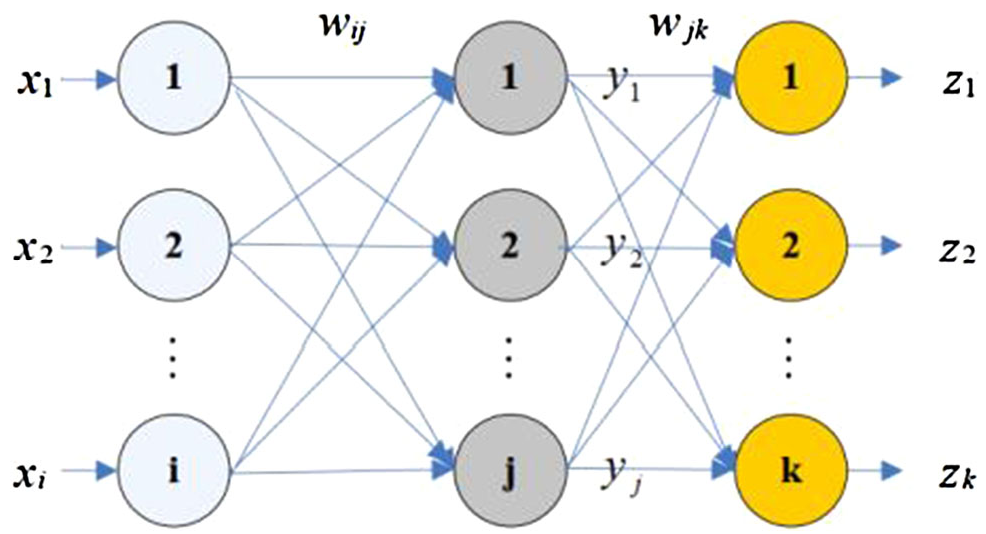 Figure: The three-layer BP structure connecting input financial indicators via hidden nodes to the classification output.
Experimental Results: The Indicators that Matter
The study filtered 470 financial data points down to 161 core indicators across nine categories, including profitability, solvency, and operating capacity.
Key "Smoking Guns" of Financing Trade:
Through Logistic Regression, the paper identifies six statistically significant variables ():
- Accounts Receivable: Often inflated during financing trades.
- Notes Payable: Used as a leverage tool.
- Taxes Payable: A secondary check on actual vs. reported profit.
- Net Profit Rate & Operating Income Growth.
Algorithm Performance
The comparison between K-Nearest Neighbors (KNN) and Support Vector Machines (SVM) shows remarkable consistency.
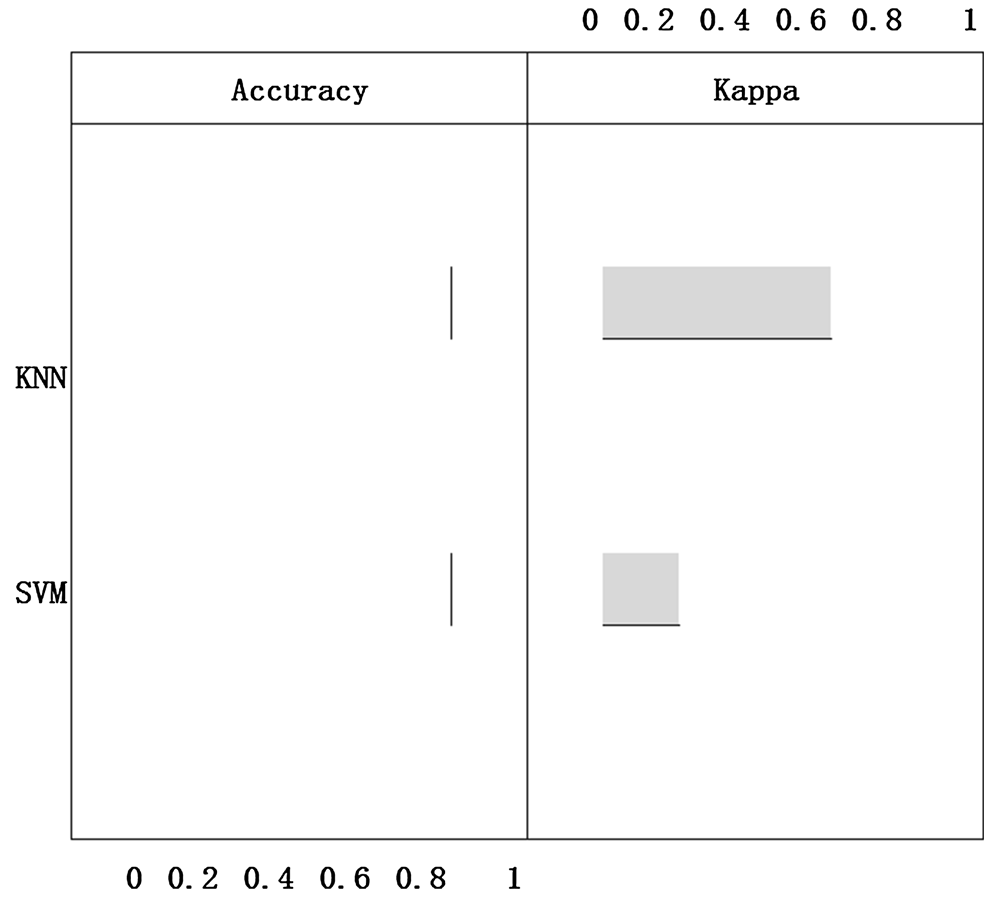 Figure: Comparison of P-values and regression coefficients for the correlation-removed model.
- Accuracy: Both KNN and SVM achieved >97% accuracy.
- Reliability: The Kappa coefficient for KNN was notably high (>0.4), indicating strong model consistency rather than random chance.
Critical Insights & Future Outlook
This research moves beyond simple technical analysis. It proves that machine learning can decode the "genetic makeup" of corporate financial statements to spot manipulation.
Limitations: The model is primarily trained on historical data of Chinese listed companies. Its portability to markets with different regulatory standards (like the NYSE) remains to be tested. Furthermore, the reliance on quarterly reports means the model is a "lagging" indicator; shifting to real-time transaction data could be the next frontier.
Conclusion: As quantitative investment moves from a "speedboat" to the mainstream, these machine learning tools will become the standard defense mechanism for regulators to maintain economic stability.