
Beyond Numbers: Finding True Influencers Through Intervention Analysis
Finding Influencers in Temporal Social Networks Using Intervention Analysis
The paper introduces a novel framework for identifying influencers in temporal social networks by utilizing Intervention Analysis. Instead of relying on static graph topology, the authors measure influence qualitatively by analyzing how an individual's presence affects the time-series attributes (e.g., citation counts) of their connections, identifying significant "interventions" in performance.
TL;DR
Most social network metrics tell us who is famous, but not who is transformative. This paper pioneers a method to identify influencers by measuring their impact on the performance time-series of their collaborators. By treating social interactions as "interventions," the authors can identify mentors and catalysts who significantly boost the productivity of those around them, revealing a ranking that traditional metrics like citation counts completely miss.
The "Teacher" Intuition: Why Topology Isn't Enough
In a standard social network, a node's importance is often defined by its connectivity (Centrality). However, in a "social learning" context—like a PhD student working with a professor—the professor's influence is best measured by the improvement in the student's output after they start collaborating.
The authors argue that existing models are too static. They ignore the "why" and "when" of influence. To solve this, they treat a social link as a potential intervention in a person's professional life. If a researcher's publication rate jumps significantly after collaborating with Person X, Person X receives the credit for that "intervention."
Methodology: Detecting the "Spark"
The core of the paper lies in the Performance Function . This function analyzes a user's attribute time-series (e.g., papers per year) and assigns a score to each time point based on how much of a "turn-around" or "boost" occurred.
1. Two Flavors of Analysis
The authors propose two ways to calculate this boost:
- Before and After Average (BaAA): A simple sliding window approach. It compares the average performance years before and years after a collaboration. It's fast but requires manual tuning of .
- ARIMA (Auto-Regressive Integrated Moving Average): A sophisticated statistical model that accounts for existing trends and noise. It can detect if a performance jump is a genuine shift or just random fluctuation.
2. The Social Influencer Score ()
The total influence of a person is the sum of all performance boosts (or drops) experienced by their neighbors during the period of their connection. Mathematically:
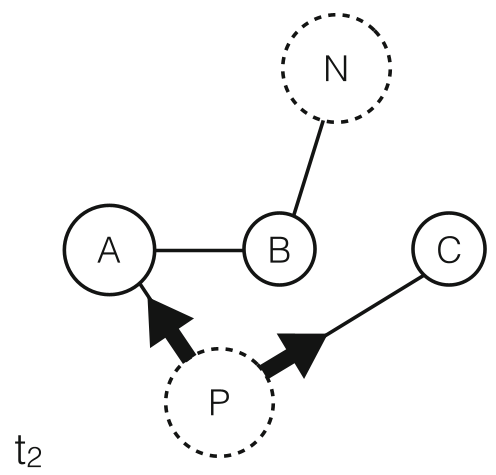 Figure 1: Social learning visualization. Teacher P (Positive) causes students' scores to grow, while Teacher N (Neutral) does not, despite having similar connections.
The "Hero" Experiment and Real-World Results
To prove the method works, the authors created a "Hero" experiment. They took a random person in a synthetic dataset and artificially boosted the productivity of their collaborators.
- BaAA works perfectly if you know exactly how long the influence lasts ().
- ARIMA performs consistently well without needing to know the "duration" of influence beforehand.
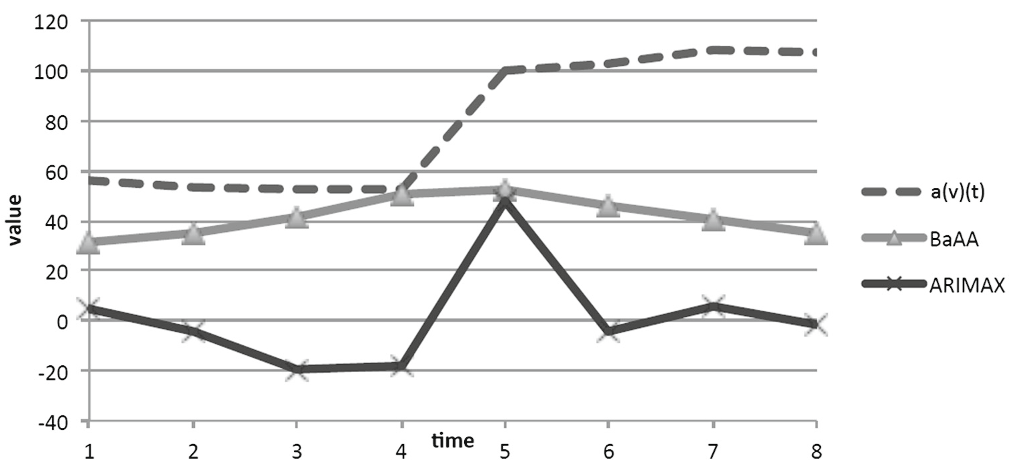 Figure 2: Comparing BaAA and ARIMA. ARIMA (the red step) is much more precise at pinpointing the exact moment of a performance boost at t=5.
The ACM Ranking Surprise
When applied to the ACM citation graph, the results were eye-opening. Legendary researchers like Jim Gray ranked much higher in "Influence" than they did in standard "Field Rankings." This suggests that while some researchers publish a lot, others like Jim Gray have a specific "multiplier effect" on their co-authors' careers.
Critical Insight: Quality vs. Scalability
The paper highlights a classic trade-off in data science:
- ARIMA provides deep, high-quality insights but took 3,365 days (simulated time) to process the full dataset, vs. just 27 seconds for BaAA.
- Limit: The model credits all neighbors equally for a boost. If a student works with two professors simultaneously, the current model struggles to attribute the "intervention" to the correct individual.
Conclusion and Future Work
This research moves us closer to a "Quality of Interaction" metric for social networks. Future iterations could involve decay functions (modeling how influence fades over time) and more complex attribution models to handle multiple simultaneous influencers. For HR departments, academic boards, and community managers, this path leads to identifying the "silent mentors" who are the real engines of growth in any organization.